NOKSEK Breaking Higher?
11th August 2016
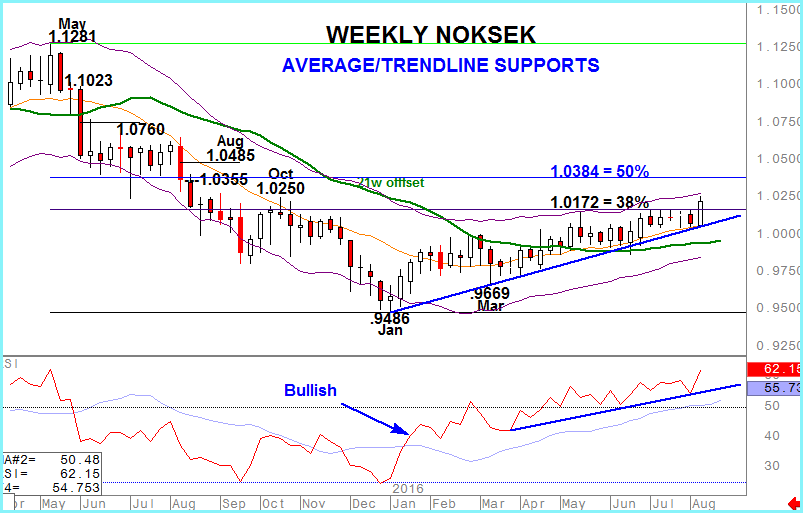
…Our Trend Table has highlighted a positive trend in NOKSEK for some months but the topside has, until now, been capped by a 38% recovery point. This level is now being seriously tested.
The low from last years decline was posted this January and the RSI indicator moving above it’s moving average was the first indication that the bear trend was at an end. Confirmation was relatively slow in coming, late April, but given the extent of the 18 big figure fall this was not surprising. The subsequent positive NOKSEK trend since has been gradual and, as mentioned above, capped by e 38% recovery of the 7 month deterioration (1.1281 – .9486).
But, supported by a trend of higher weekly lows, the mid-point of the weekly Keltner channel and a trendline in the RSI this week’s demand for NOKSEK is seriously testing that correction point.
Will it break, on a closing basis? Friday’s close will provide the answer to that of course but our signals for sentiment suggest that it will with the market then expected to focus on a broader 50% recovery point at 1.0384 then 1.0485.


