Commentary
3c Analysis Commentary Page - Adding Value
On these pages we will expand upon some of our forecasts, talk about other moving markets from a technical analysis perspective, explain technical analysis tools from a practical perspective and include guest commentary from a variety of roles across the financial markets.

We agree with the Saxo & Blackrock views in this intersting article.Please click... read more
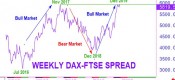
Longer-term 3 month signals have been bullish throught 2019 and our strategy to stay long and buy dips has been the correct one.However, although there is no clear bearish reversal pattern on longer dated DAX-FTSE charts, signasl in the shorter-end are highlighting warnings.Initially divergence on momentum indicators, last week the US ending long trend of higher... read more
This article is about Keltner channels and how, using them as trend indicators, they can aid trading on almost any time scale.Firstly we’ll cover the theory then practice of how I use them in analysis across the asset classes with some recent examples to see how they work.Keltner channels can be invaluable as a tool for... read more
I've pointed out on these pages before how useful both RSI and Keltner channels can be to traders across the asset classes. What I'd like to show today is how the two indicators can combine in another method of application for trading. This article is going to look at using Keltner channels around the RSI indicator rather than... read more
For the first time since last August, our trend following signals for AUDNZD have turned bullish.Last year's peak in August was signals by a Bearish Dark Cloud cover pattern on weekly candle charts. That bearish pattern was followed, 2 weeks later with a negative 'dead' cross of the 21 week moving average and a matching cross... read more
