Trading Bunds, RSI and Keltner channels
7th November 2019
I’ve pointed out on these pages before how useful both RSI and Keltner channels can be to traders across the asset classes. What I’d like to show today is how the two indicators can combine in another method of application for trading.
This article is going to look at using Keltner channels around the RSI indicator rather than the spot price and, unusually for my normal way of analysing the market, is not a clear trend following application.
What we’re looking for is the RSI indicator being outside the Keltner channel bands. When Keltner channels are used on the spot price, a hugging of one of the extremes of the band highlights a trending market – a market that is there to be ‘ridden’.
But when applied to the RSI, prices outside the channel suggest oversold/overbought extremes and this fact can be used when the RSI moves back inside the channel. Sometimes this can be used to lock in profits, sometimes to renew/add to the underlying position and on other occasions indicates a change in the underlying trend.
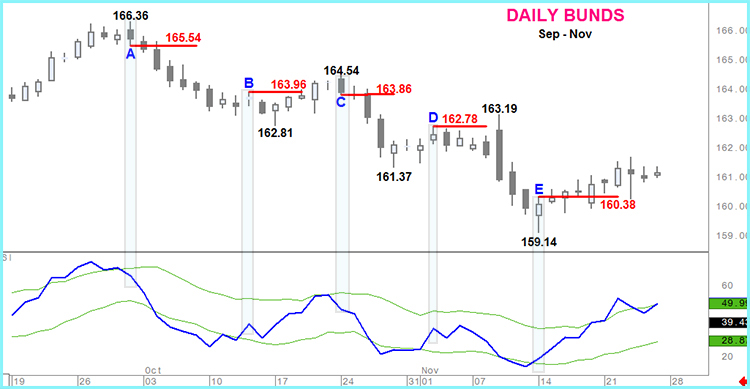
Daily Bunds
Point A is where RSI moves back inside the top of it’s Keltner channel for the first time. The important thing to note is that confirmation is required in the form of the following day’s trading taking Bunds below the low of the day the signal was given. In this instance that confirmation was met. Prices then fell steadily for more than another week – a move that took RSI below the lower end of it’s Keltner channel and primed for a reaction.
B gives a positive move back inside the channel with this counter-trend move needing validation in the form of a move through 163.96. That did not take place over the next 3 days by which time the market was close to the top of the Keltner line and negating the positive signal. Don’t forget that with this methodology we’re not riding a Keltner channel like we would in spot!
C is a negative RSI signal and ratification was provided the next day by a move under 163.86.
D – is similar to B where there is not immediate confirmation and so the bullish signals are dissipated
Finally the potential bullishness given at point E is immediately correct with the extent of the subsequent spot upside reflecting the likelihood of an end to the bear trend and a of new positive one developing.
What is interesting to note is that these points are often given an importance by the RSI that the spot price action would not provide and yet they act as subsequent support/resistance levels (on a closing basis).
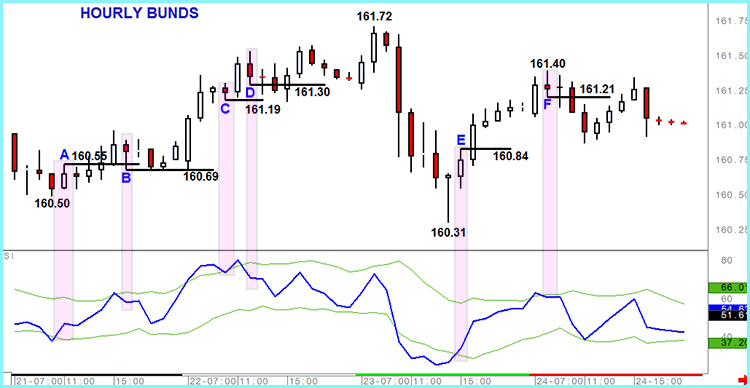
Hourly Bunds
I’m going to drill down to the hourly chart now. As in all technical indicators/tools the longer the time frame the more influential they are. In other words less likely to give false signals. Nonetheless this method still works in this short time frame but you do have to pay less attention to signals given close to the end of a trading session (even applicable to FX markets where Asian signals have to be given less weight).
Point A is a positive RSI trigger that a move beyond 160.55 confirms. There is upside profit potential but this is swiftly followed by point B that marks a negative move by the RSI back inside it’s Keltner channel. Interestingly though this came late in the day so less weighting was applied and the low went unbroken so there was no ratification and so no short position.
C was another unsubstantiated RSI trigger and although this was soon followed by D, this time potential profits were very minor and short lived. A false (ish) break as mentioned above.
Point E was confirmation of the bullishness of the powerful downside rejection of 160.31, was immediately proved by higher prices in the next hour with subsequent solid gains leading into the first 2 hours of the next day.
Finally that next day created a negative RSI signal, F, that had some reasonable intraday success.
I think that you can see that this rare combination of RSI and Keltner channel has merit and is something that we use actively in our analysis and our live management of those forecast through our updates.


