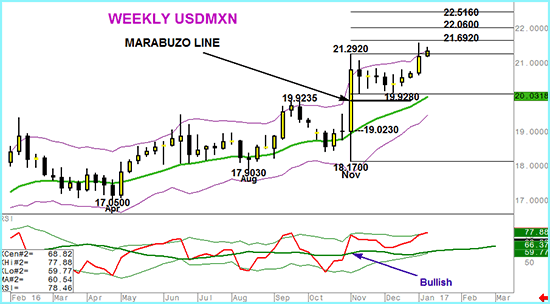
USDMXN – Demand accelerates after setback
10th January 2017
Our assessment of trend for USDMXN was dominated since April with a bullish bias.Trading at the end of last year in USDMXN was, unsurprisingly, dominated by the US election and the comments made during the campaign by Trump. The wild swing in investor sentiment around the result announcement created a week’s range of 16% of the value going into that week. But, bar a dip in October, the currency pair was already trending higher.
Subsequent to the election the market saw a reaction that stretched over 5 weeks but the profit taking was weak and failed to reverse even half of the net gains posted in the first full week of November. Unable to test that Marabuzo line demand was renewed with last week’s strong upside the most bullish USDMXN performance for 8 weeks.
The 21 week moving average continues to support as does the equivalent moving average on the RSI indicator. In addition, both spot USDMXN and RSI are now tracking their Keltner channels and we see now sign yet of anything other than further upside that now has potential to Fibonacci projected levels of 21.6920, 22.0600 or even 22.5160.


