NOKSEK – Testing Key Average
9th March 2017
Trading this year in NOKSEK has given some mixed signals after last year’s clear and aggressive upside.
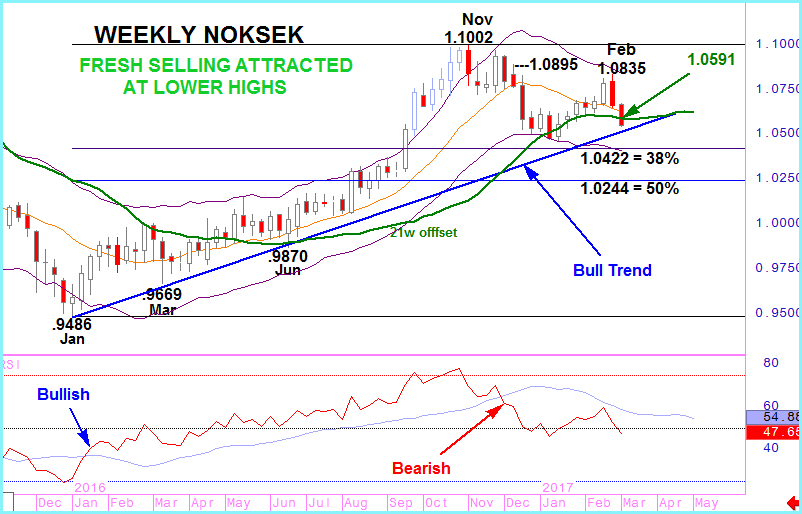
Profit taking from November’s peak above 1.1000 led first to a negative cross in our RSI indicator during December then followed in January with a cross of it’s 21 week offset moving average. But that confirming move move proved a temporary one and January/February was dominated by a gradual rise in NOKSEK .
However last week’s strong decline signalled a significant lower high which has been followed with further selling pressure this week.
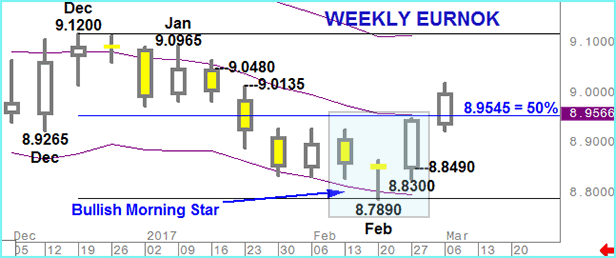
Both EURSEK & EURNOK found buyers at the 13 day moving average but the aggressive buying in EURNOK created a Bullish Morning Star pattern on weekly charts. This has led to NOKSEK testing the key 21 week line again. This point is still a little way above a trend of higher weekly lows but with RSI still negative from December we’re looking for a close below the average, currently at 1.0591, to confirm a bearish bias for the medium term with downside objectives to include 1.0422 and 1.0244.


