US$ Index – Temporary Rally?
1st November 2017
US$ INDEX, still long-term bearish, but looking to trade bounce
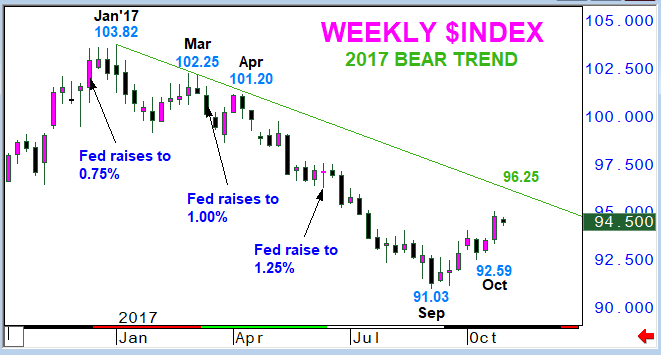
We have been bearish of the $Index throughout 2017 and in our last update on May 11th we emphasised this view by highlighting the inverse relationship between US interest rates and the US$ exchange rate.
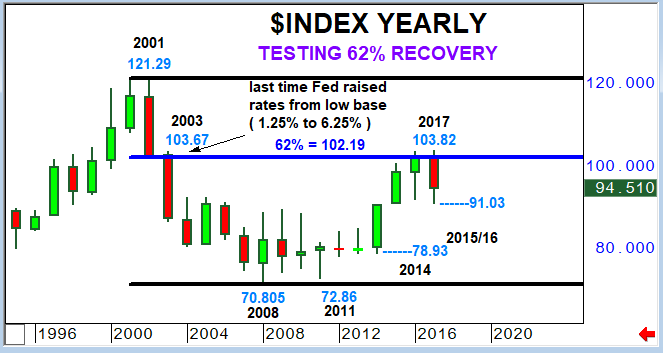
The sell-off has also come from close to a 62% recovery to the entire 2001 – 2005 bear market and it has ended a sequence of higher yearly lows which is negative for $ Index sentiment. This 62% Fibonacci is also close to the 2003 top and the last time the Fed raised rates from a low base was in 2003 where they moved from 1.25% to 6.25% in 2006. We remain long-term bears.
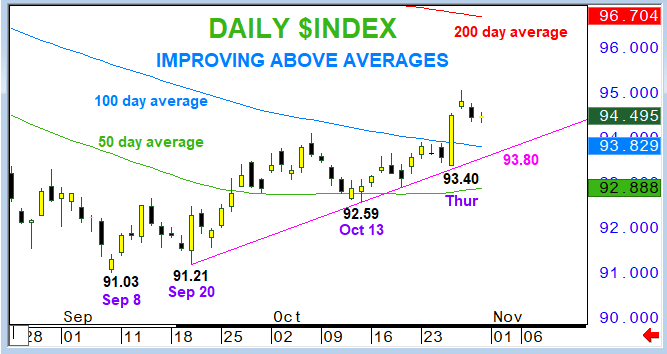
However, the markets rarely move in straight lines and for the 1st time in a long while our shorter-term $ Index signals on the trend table have turned temporarily positive. Improving sentiment since September has taken prices above their 50 & 100 day average rates and towards the 200 day line.
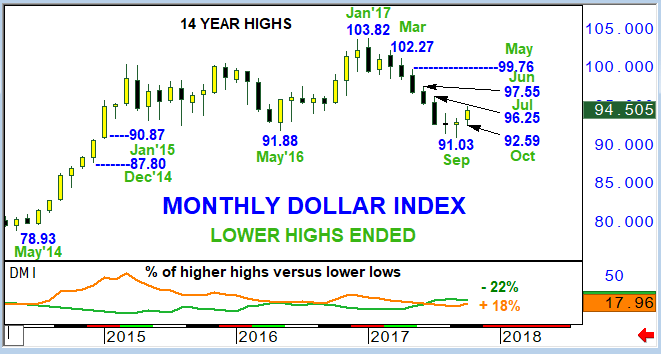
More importantly a long sequence of lower monthly highs has been ended which signals a temporary recovery.
We have therefore cut back on long term shorts but are looking to reinstate between 96.25, a weekly bear trend and 96.70, the 200 day average rate. The stop is for the Index is at 97.55, June’s high trade.


