Gilts – Using Fibonacci to target
11th February 2016
This year has seen a strong trend higher across all the Fixed Income futures markets. Identifying the trend has been relatively easy using moving averages and Keltner channels but how to predict upside levels, especially with new contract highs being posted in recent days?
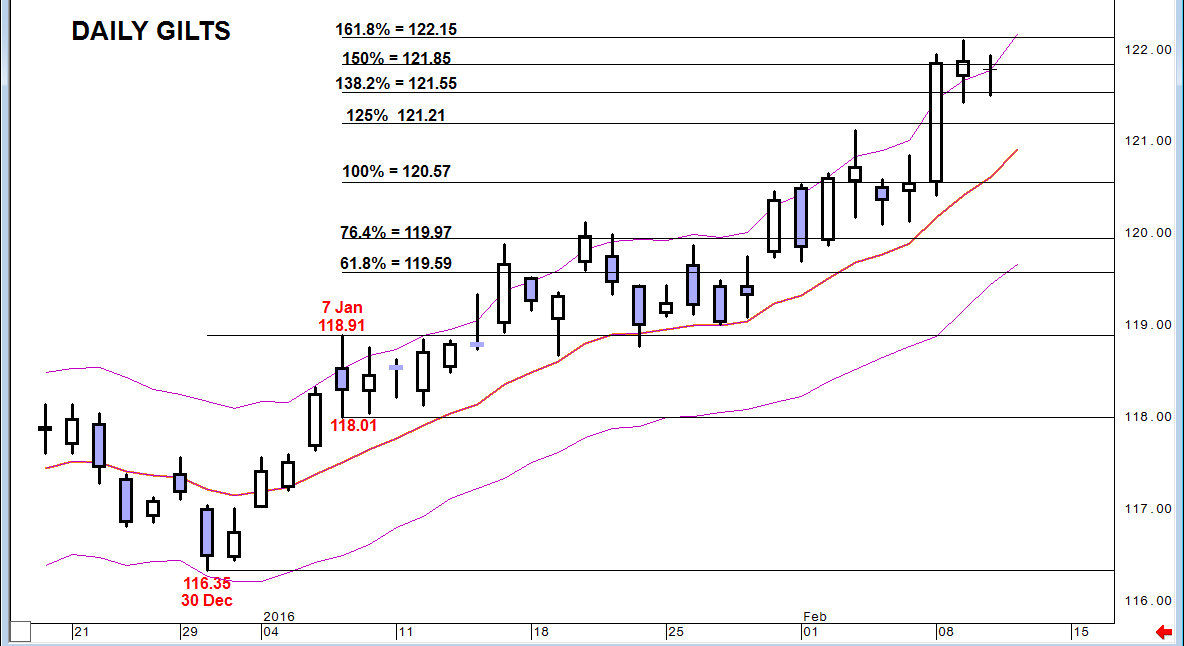
An extremely useful tool that we turn to is Fibonacci extensions. And to illustrate this I’m going to use March Gilts. So lets look at the first chart;
 As opposed to Fibonacci retracements which use 2 points (low and high or vice versa), an extension using 3. For an upward move the initial point will be a significant bottom and for Gilts that level is pretty obvious; Dec 30th low of 116.35.
You then need a high that leads to a correction, then the low of that correction. In other words it is necessary to wait until the 3rd point is created before its possible to create upward targets. In the case we’re looking at the first important high is created by price action on January 7th. What is unusual in this example is that the significant high and the subsequent low is formed on the same day – 118.91 and 118.01. Confirmation of this is provided by the next day’s trading which forms a higher low.
Marked on the chart are extension points from 61.8% through to 161.8% (smaller projections are less relevant – except for intraday trading- until the move is greater.
You will be able to see all of these points (except the 138.2%) had an impact, notably on a closing basis. Giving profit taking opportunities and, in most cases, allowing late buyers to use setbacks.
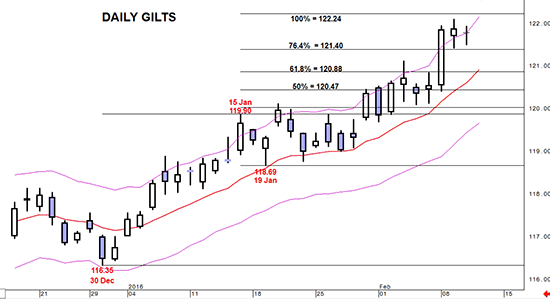
Of course as a move extends, other significant highs and setback lows are formed and it is wise to use those points to calculate updated targets and this is what I’ve done with the second Gilts chart above. As you can see there is relevance to the 50% and 61.8% points but the impact of this updated extension is less than the original.
When a trend is as entrenched, and aggressive, as this one in Gilts, prices will eventually outpace the extension levels and this what we have faced in the current markets.
Our final chart shows an updated low created on January 19th, 118.69, and new high/low on 3/4 February. This extension gives us the current upside potential levels with today’s positive gap higher giving a strong test of the 100% extension point, 122.56.
Failure to close above that point should lead to a temporarily corrective move.


