Trading Gilts with Keltner & Fibonacci
24th February 2016
I have written on these pages before about the benefits of using Keltner channels to highlight trends across asset classes and time periods.
Here we’re going to take a look at intraday trading in Gilts and where the current upside is likely to go.
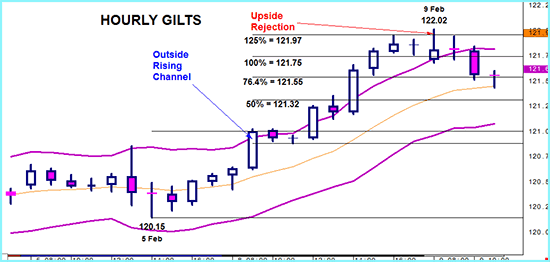
Firstly to establish a background, the chart below shows Gilts from 5th February to the 9th. Confirmation of a key low at 120.15 was produced by the strong buying early on the 8th that took Gilts outside the top of the hourly Keltner channel.
This established a trend and targets were established by means of Fibonacci extensions after the market attempted profit taking after the move higher (extensions do, of course, require 3 data points).
As you can see prices kept either hugging the channel, or exceeding it with the market rising a full point. The 50% extension did give Gilts pause for thought but it was until the 125% level that the market stalled.
The potential for topping was provided by overbought stochastics with confirmation given by the strong upside rejection (Bearish Inverted Hammer).
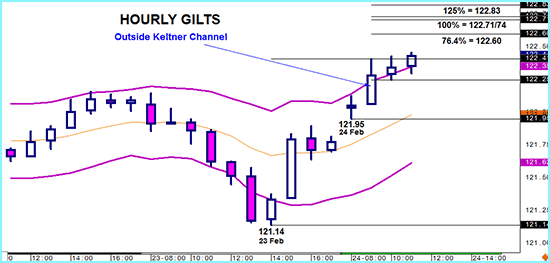
The current situation is similar as you can see below;
This morning’s price action has seen buyers build upon a gap higher at the open and exceed the top of the channel – confirming a strong intraday trend.
Upside targets are 122.60, 122.71/74 and 122.83
For the longer term traders amongst you, this method of identifying trends with the Keltner channel and targets with Fibonacci extensions works just as well on daily charts.
UPDATE – Prices moved sharply higher during the day with a high of 122.75


