Archive posts for 'Commodity'

We agree with the Saxo & Blackrock views in this intersting article.Please click... read more

Your Own Worst Enemy. - Why it is so hard to develop a real ‘Behavioural Edge’ in Trading.a guest article by Steven GoldsteinThe Dunning-Kruger effect is a behavioural bias which refers to people’s belief that they are more capable than they really are. This is a cruel trick played on traders by themselves which keeps most... read more

My Favourite Books on Technical Analysis.When I first got into Technical Analysis the only real way to learn was by reading books by those technicians that had started the ball rolling in modern times, and by playing with simple indicators on graph paper. The arrival of dealing room computers and then software accelerated the emergence of... read more

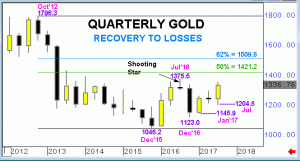
A 10 year rally in GOLD throughout the 2000’s has stalled:, but with deteriorating sentiment between 2011 and 2015 attracting buyers back to the market from close to 1087.5, a key 50% correction to the gains.Last year’s bounce has also stalled, - ahead of 1421.2, a 50% recovery to the 2012-2015 losses and a quarterly Shooting... read more

Commodities in 2017 - Cheap against Equities?a guest article byJEFF DESJARDINSJeff Desjardins is a founder and editor of Visual Capitalist, a media website that creates and curates visual content on investing and business.WEBSITEIf you’re looking for action, the commodities sector has traditionally been a good place to find it.With wild price swings, massive up-cycles, exciting resource... read more

Courtesy of: Visual Capitalist CHINA AND U.S. STILL GENERATING >50% OF REAL GDP GROWTHThe Chart of the Week is a weekly Visual Capitalist feature on Fridays.According to forecasts from earlier this year by the World Bank, the global economy is expected to average a Real GDP growth rate of 2.8% between 2017-2019.But where will this growth actually... read more

Longer-term signals have been bullish of Gold so far this year.The sell-off since the all-time high in 2011 at 1921.5 has attracted buyers back to the market in 2015 and 2016 from close to 1087.5. a key 50% pullback to the entire 2001-2011 ten year bull-run.Updates on 23rd January and 10th Feb have continued to highlight... read more

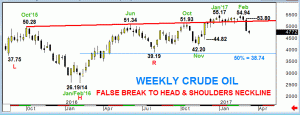
Crude Oil - Trend Bearish, but Pullback should be TemporaryA break, at the beginning of 2017, above the neckline to a broad bullish weekly Head & Shoulders pattern which was formed with a "Head" at last year's 14 year Oil low at 26.14 has proved a false one.Last week's decline took the market back under that neckline... read more

Chart: How Bitcoin Reached Parity With GoldCHARTING THE FAST AND VOLATILE RISE OF BITCOINThe Chart of the Week is a weekly Visual Capitalist feature on Fridays.Would you rather have one bitcoin, or a single ounce of gold?The answer used to be obvious. Even at the climax of the legendary 2013 rally, bitcoin was never able to... read more

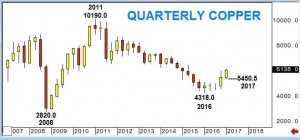
Copper is the only market we cover in the trend table and following a long period of bearish sentiment our signals switched to bullish in the weeks leading up to, and confirmed following the US Election in November.The other base metals have signalled a similar switch, buyers returning to the market in early 2016, well before... read more


