Bunds – Yields tracking channel lower
5th April 2016
Where does demand take Bunds next?
For a change we’ll take a look at the direction for sentiment in Bunds from a yield persective.
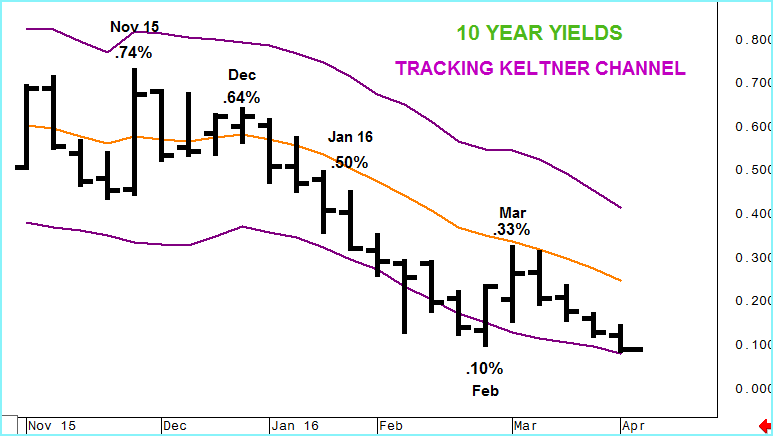
As you can see from the chart this year has been dominated by a decline in rates with this week’s movement taking prices below February’s low. The strength of this negative trend can be gauged by the ‘hugging’ of the lower end of a declining Keltner channel from late January for 6 weeks.
Overbought sentiment in Bunds then resulted in profit taking that took yields .23% higher. But the important point in this bounce was that the market was capped by the mid-point of the Keltner channel, which is also the key 13 week moving average.
The failure at that point emphasised the underlying tone and the market is now back at the lower end of the band and, we expect, will continue to track yields lower.
So, how does this equate to Bunds and their upside targets. For that we’ll drill down to a Daily chart and use Fibonacci extensions. (Importantly you can see that the latest leg higher in the June contract is being supported by the 13 day moving average.
Prices here have also returned to the top of a positively trending Keltner channel. Despite some concerns with overbought signals the market is expected to grind higher with targets of 164.55, 164.90 or even 165.34.
The risk level we are constantly monitoring, in the immediate term, will be the 13 day line, on a closing basis.


