T-Notes – Bearish Falling Three developing?
24th May 2016
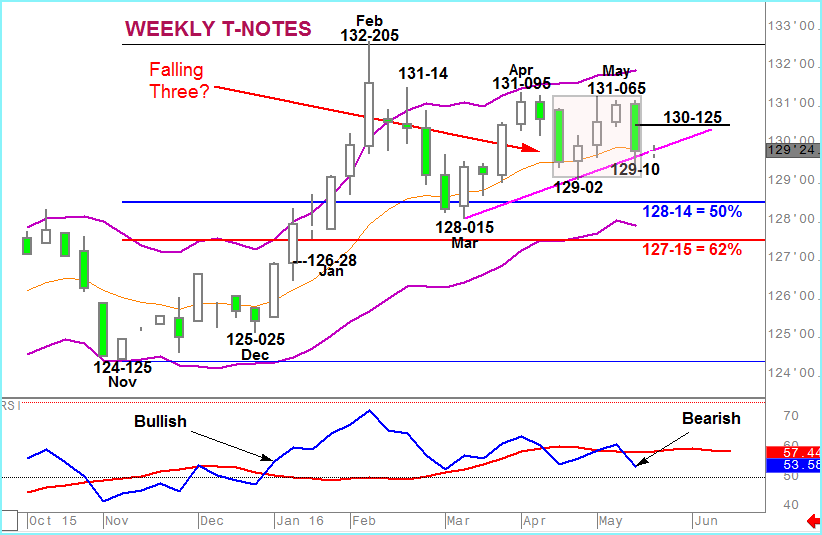
…Is a Bearish Falling Three pattern on weekly candle charts developing?
Last week’s strong decline of more than a point ending a sequence of 3 weeks posting minor gains. This upside countered the strong fall that preceded it and forms the first candle in the potential 5 candle Bearish Falling Three.
This move was enough, coupled with a negative break in RSI of it’s moving average, that led to this week’s 3cAnalysis forecast being bearish.
But there are a number of factors that introduce a note of caution;
- The downside has stalled at the mid-point of the weekly Keltner channel (the 13 week moving average)
- A developing trend of higher weekly lows has also attracted buyers.
- Although the RSI/average crossover was negative there was a false break in April.
So we need to see confirmation of the pattern before looking for a significant deepening of the selling pressure. That would, in our assessment be a move below last week’s 129-10 base (though some purists may favour 129-02).
The market is then likely to look at Fibonacci targets at 128-14 and 127-15 (March’s 128-015 low being an interim point).
This Falling Three formation will only be negated by a move above the pattern’s 131-065 high although a weekly close above last week’s 130-125 Marabuzo line would concern.


