CABLE – Head & Shoulders targets 1.5100
11th May 2016
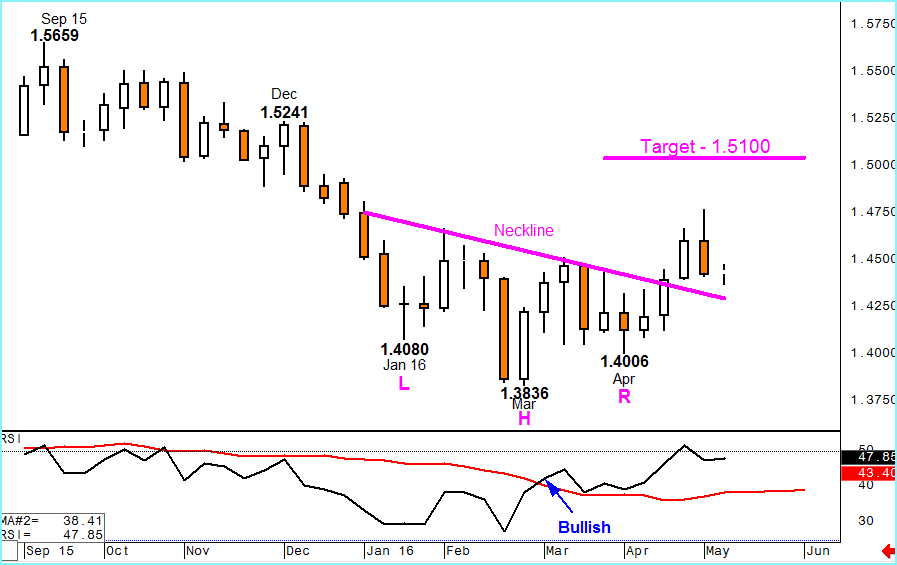
….The background to medium term analysis to CABLE has to be the bullish inverse Head & Shoulders pattern that the chart below shows.
 This year’s trading has been dominated by downside attempts in January, March and April that formed the three bases that create the Head & Shoulders formation. This pattern very often confirms a strong change in sentiment.
This pattern and the break of the neckline 2 weeks ago also confirms the bullish divergence that RSI highlighted back in March when the ‘Head’ was being formed. Last week’s rejection of the highs is taking CABLE back to the neckline, currently at 1.4300 but doesn’t negate the pattern.
The potential for gains is as high as 1.5100 which is a target ascertained by deducting the price at the lows from the level of the neckline at the time (1.4552 – 1.3836). That pip value (716) is added to the price of the neckline at the break (1.4376) to provide us with a 1.5100 objective.
Of course this only provides potential for the pattern to be proved – these signals are never fool proof but the RSI signal will be watched carefully to warn if the demand for sterling is less than currently assessed.
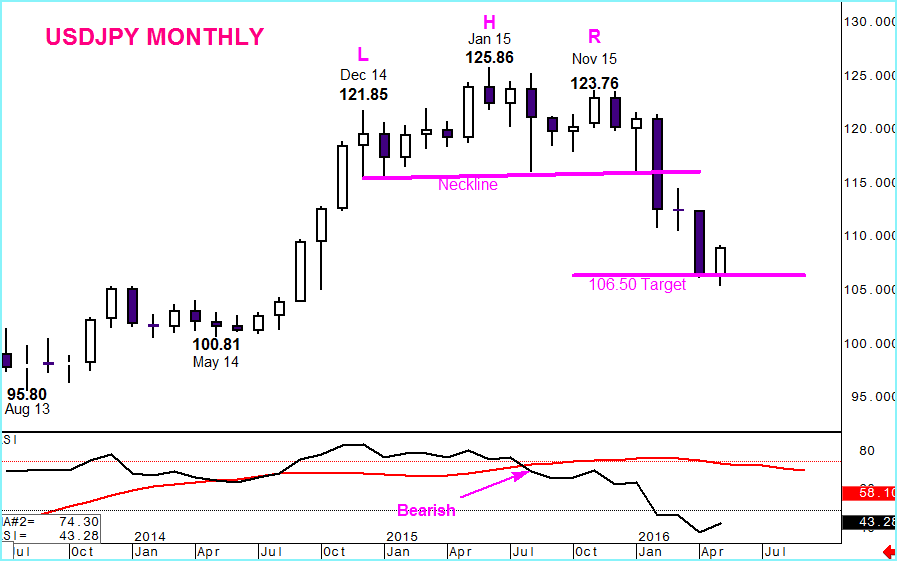
For an example of how well a Head & Shoulders pattern can work we can look at a Monthly USDJPY chart below. Here the pattern was more aggressive with the neckline untested after the break but the RSI divergence was also an advance indicator after the ‘Head’ was formed and the exact 106.50 target has, over the last 2 weeks, attracted buyers.


