CADJPY – Sentiment now Negative
20th March 2017
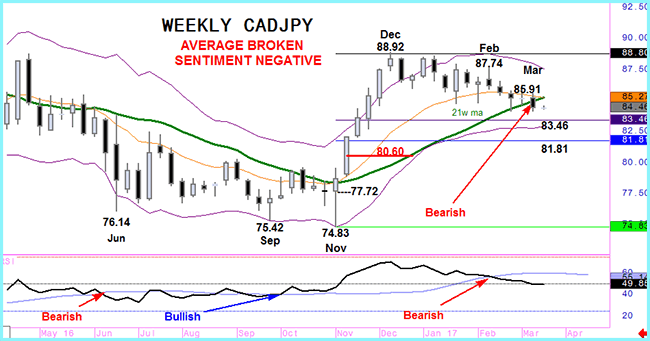
Last week’s CADJPY decline continued a gradual series of lower weekly highs and the drift back from December’s peak. The negative cross of the 21 week moving average confirmed the earlier break of the RSI indicator through its average.
As you can see from the chart these indicators captured the bear trend that dominated the 3rd quarter of 2016 and the CADJPY bullish move that ended last year. Although this year has seen the market come off those highs the setback has reversed less than 38% of the Nov-Dec move.
But although the reactive move is limited in that sense the time element has led to a bearish break of the averages and a tentative turn in the weekly Keltner channel.
Until the 38% line is broken caution does need to be applied but our studies have turned negative, see Trend Table, and we now target Fibonacci CADJPY correction points at 83.46 and 81.81.
Only a move back above the averages would threaten this bearish bias for investor sentiment.


