NOKSEK testing key M/T Moving Average
19th October 2017
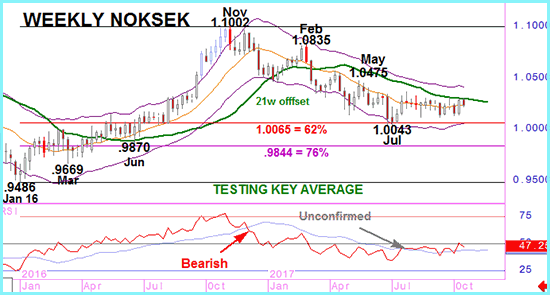
A sharp move lower at the beginning of March in NOKSEK took the market below the 21 week displaced moving average and generated an outright bearish call. This move confirmed a ‘dead’ cross already provided in RSI.
Prices then fell by more than 4 big figures – correcting more than 62% of last year’s rise – but since July’s low the market has been broadly consolidating. NOKSEK RSI gave a bullish signal soon after the low but this has not been confirmed by spot action since and the RSI has fluctuated around its average without that confirming move in the cross.
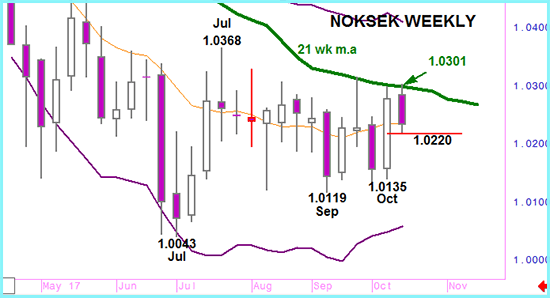
But 3 of the last 4 weeks have seen NOKSEK test the descending 21 week line. Without ever threatening to effectively break it in all accuracy. But that average bears watching closely. It comes in at 1.0301 this week and 1.0297 next week. A weekly close above is needed as confirmation, but the bears (including our medium term Trend Table bias) should be growing more nervous.
A close above and sentiment will be exposed to 1.0368 then towards 1.0475, although those targets would be re-assessed in the event of a positive break.


