NZDUSD – Bullish Trend under threat
10th October 2016
….The underlying trend in NZDUSD has been positive throughout this year but is now being questioned by the market.
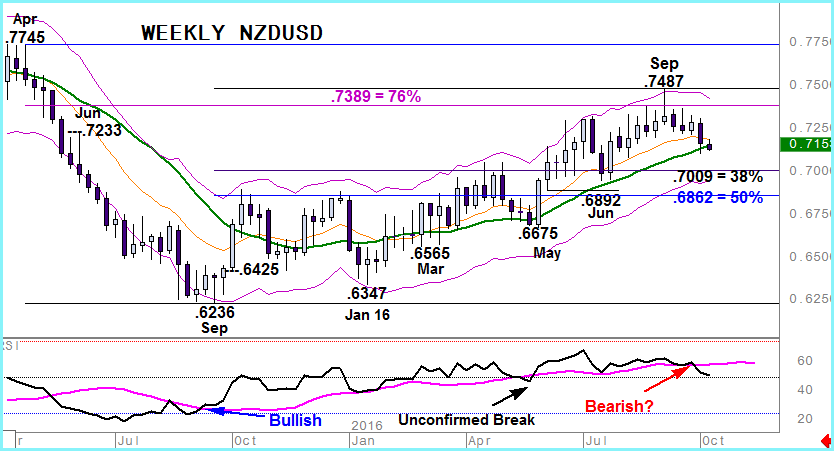
Strength indicators (RSI) became bullish more than a year ago and have proved more resilient than the spot price where the trend was threatened strongly in January, and less so in May (RSI did give a minor downside break then).
Prices have risen by more than 11 big figures from this year’s NZDUSD base and the series of higher lows and highs remains intact.
However, last week’s strong setback took NZDUSD back to the key 21 week moving average and saw RSI post the clearest break of its own moving average. This places the longer term trend under serious attack – a fact you can see emphasised on the daily chart.
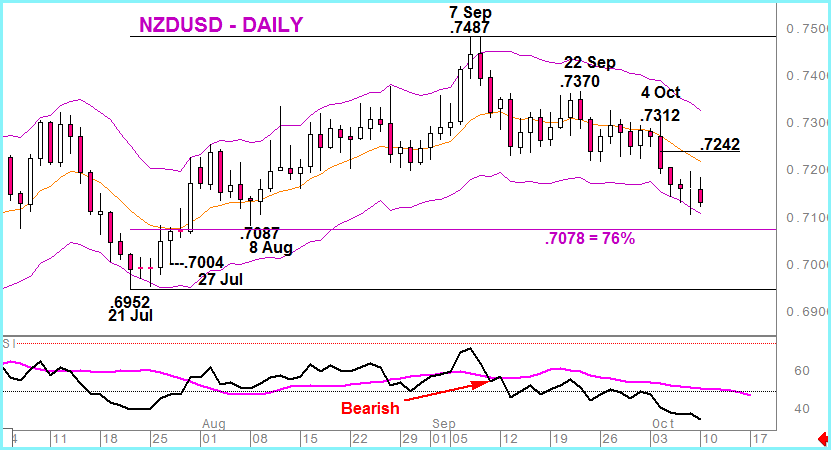
Here, the turn in sentiment from September’s peak was first reflected in a negative RSI trigger and then confirmed by the spot price falling through the 13 day moving average. Since then a sequence of lower daily highs and lows has formed with Friday’s NZDUSD fall taking the market to the lowest levels since August.
The spot price has tested the 13 day line during this time but RSI has remained solidly bearish. With the market now near the base of the declining Keltner channel there is no sign yet that the short term trend is exhausted although the fact that RSI is approaching over-stretched extremes may be relevant. Nonetheless the longer term bias has to be watched closely and the key, in our assessment, is the 21 week moving average level and this week’s close.
That point is at .7154 and a Friday NYK close beneath that point will change our medium term trend assessment to Bearish with scope to .7000/10 then .6862/92 area.


