USDCAD – How Low can it Go?
3rd March 2016
The negative trend for USDCAD is nothing new. Its been the dominant feature of 2016 – countering the strong rise that marked the latter part of last year. The first 3 weeks of this year continued the gains but the turn since has been aggressive.
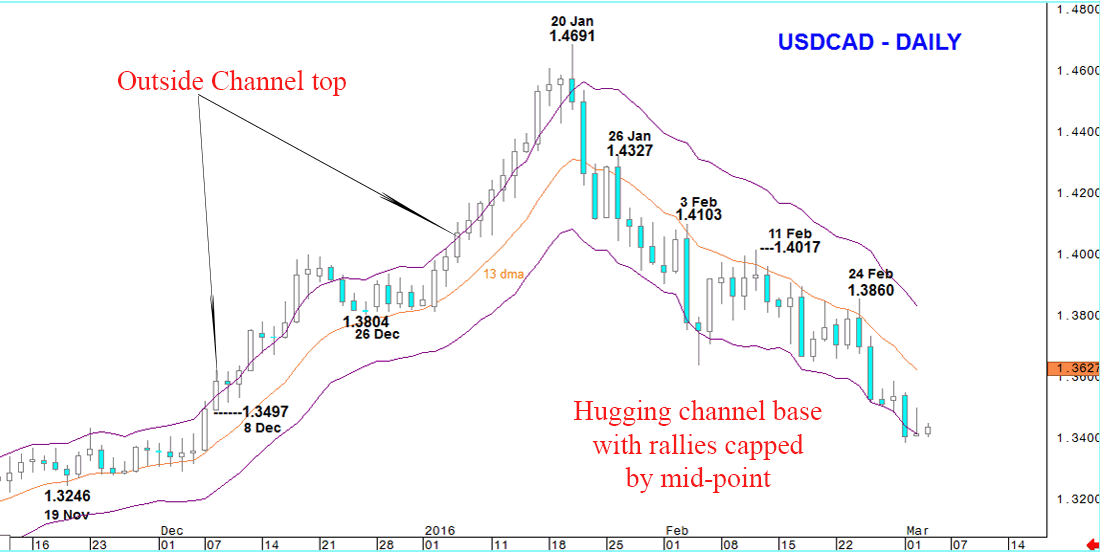
A look at the chart below shows the strength of both trends.
If anything the bullish trend in USDCAD was more pronounced with prices trading outside the top of the Keltner channel. This year’s decline has seen the market track the lower end but without breaking below to any significant degree.
Nonetheless in both case the mid-point of the channel, also the 13 day m.a, held rallies on a closing basis.
So currently we’re tracking the lower end of the Keltner channel and while intraday rallies in USDCAD can be sharp and aggressive there is no sign yet of any real turn.
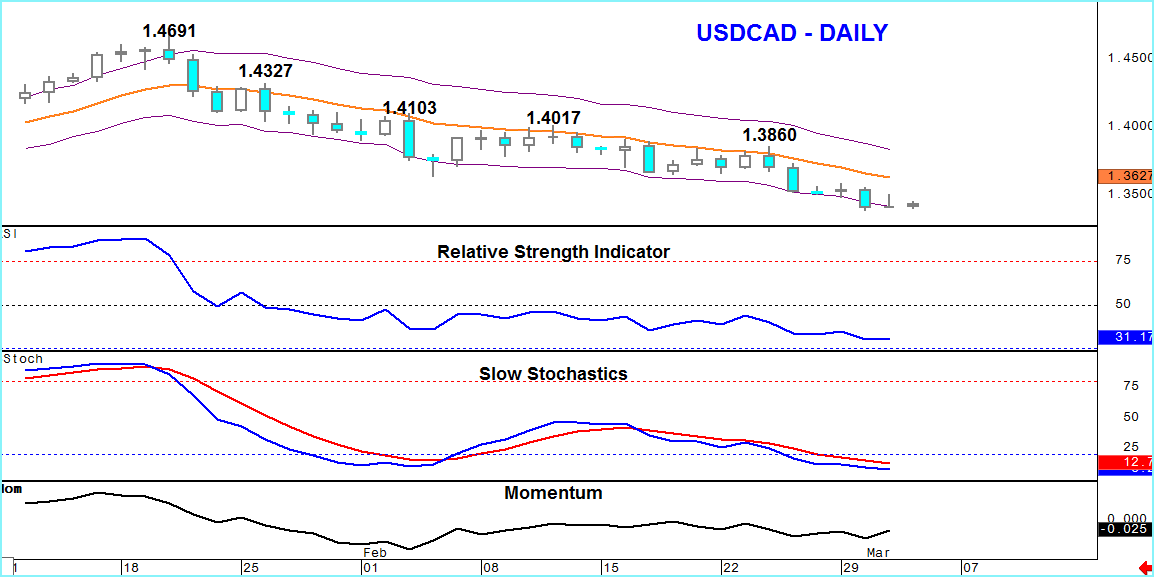
This is further illustrated by a look at some key indicators on the chart below and only Momentum is showing a less than strongly negative bias.
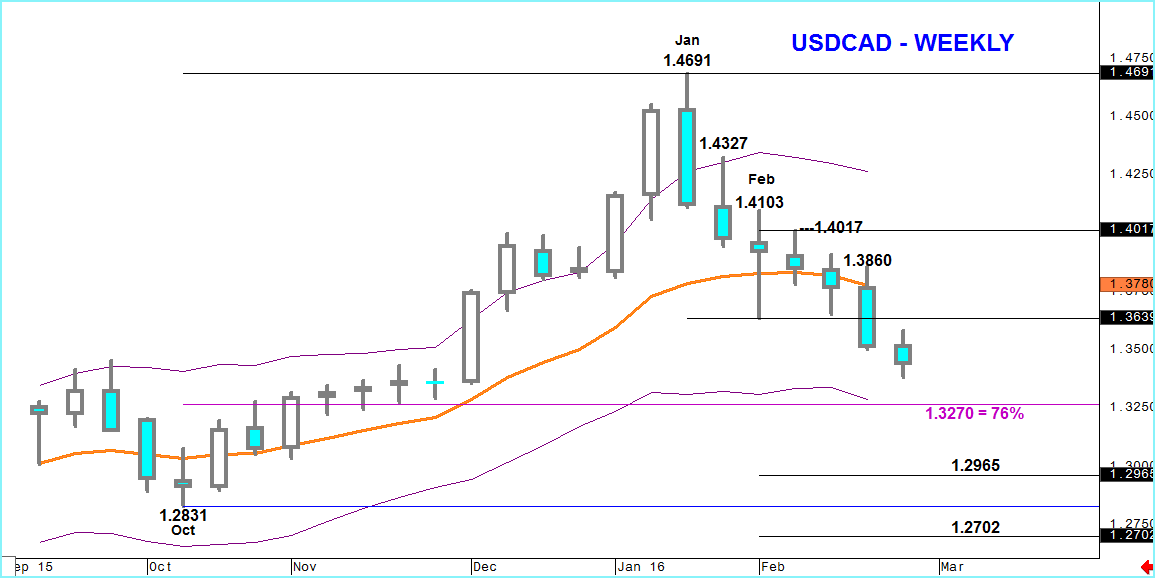
Obviously it is the 13 day moving average/mid-point of the channel that holds the key in the coming days, as a place to threaten the bearish trend in USDCAD but until that line is breached, on a closing basis, the market will look towards 1.3270, a 76% correction to the Oct to Jan rise, then a Fibonacci projected point at 1.2965.


