USDZAR – Tracking Negative Channel
16th August 2016
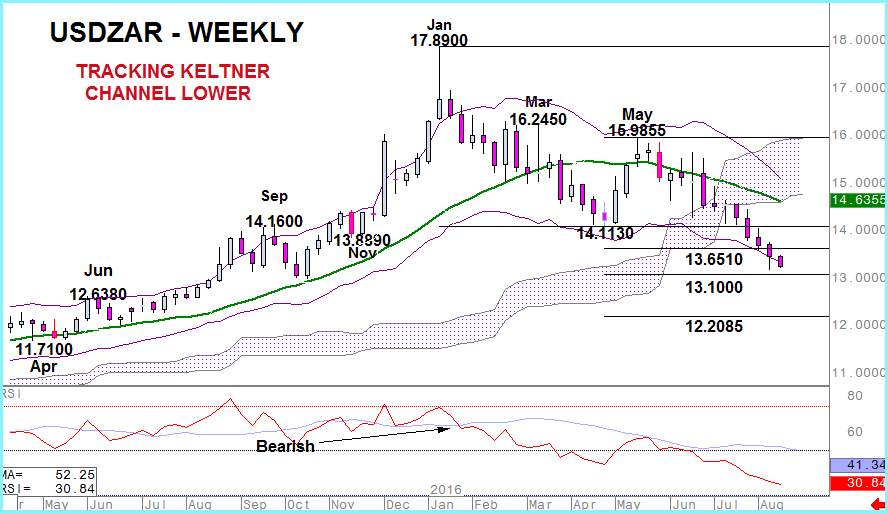
A negative tone for USDZAR was established at the end of March (see Trend Table) with prices trading down through the 21 week moving average. This acted as confirmation of a bearish trigger already given by the RSI indicator crossing down through it’s own average.
 Although spot prices bounced 5 weeks later in a profit taking move back above the moving average, there was no corresponding bounce in RSI – negative divergence confirming the underlying negative bias for USDZAR.
Interestingly July’s decline took USDZAR to a weekly close beneath the Ichimoku Cloud pattern for the first time since August 2011 and this has led to an acceleration of the downside to the most negative levels traded since October 2015.
The market has now recovered more than 38% of the 2011-16 rise (6.5425 – 17.8900) and although there is a growing likelihood of more significant profit taking we feel any bounce towards 14.1130 will find fresh selling interest especially as the RSI indicator is trading ever lower and spot prices are ‘hugging’ the lower end of the weekly Keltner channel (last year’s powerful bull trend saw similar tracking of a rising channel).
On the downside a projected Fibonacci target of 13.1000 is the initial focus for USDZAR then a more significant 12.2085/2200 area (another Fibonacci project and a broader 50% pullback point).
Currently, only a weekly close above the 21 week average (14.6355) would be considered positive – this point is of course lower each week.


