Using RSI to trade EURUSD
10th March 2016
Using RSI to trade EURUSD
I’ve written about RSI on these pages before and many of you will already be using RSI in a number of different manners to aid your trading. I want to cover a rare, though not unique, method and am applying it to EURUSD on a daily time scale.
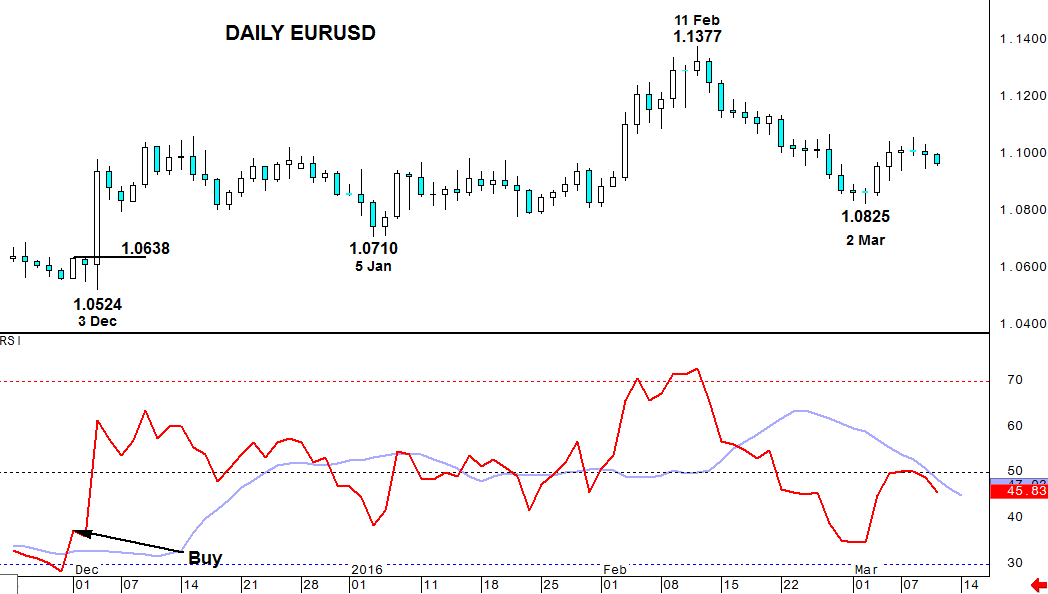
What we’re looking at here is a normal RSI indicator with a moving average of that RSI overlaid. The simplistic trigger is that when the RSI crosses above the average the market is Bullish, and vice versa.
However, that ‘trigger’ has to have confirmation. That confirmation is provided, in the case of a Bullish trigger, by a move above the high of the day that, at the close, saw the RSI above the average. In the example that follows I am only going to point out the moves that have such a confirmation (there was some false/unconfirmed moves during January).
Firstly you can see a positive trigger at the begining of December. The high that needed to break was at 1.0638. Prices then rose by more than 4 big figures during that month until going into and through January EURUSD was caught within a wide range.
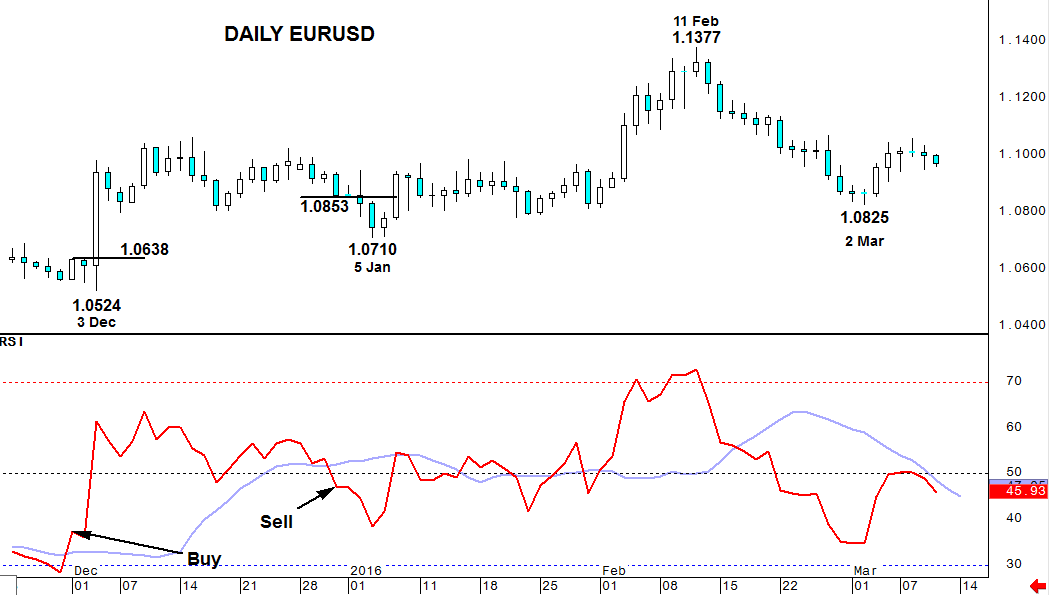
That didn’t prevent a bearish signal being provided on the last day of December. Given that this was over the Christmas/New Year period perhaps only the truly extreme trader would have been involved but there was scope during January for some modest profit potential before ……….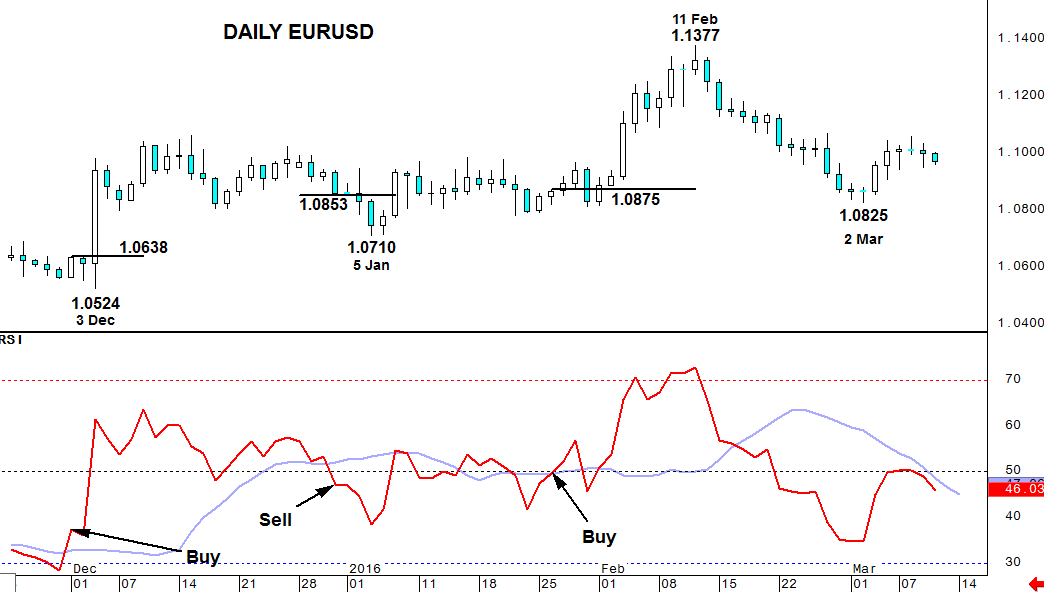
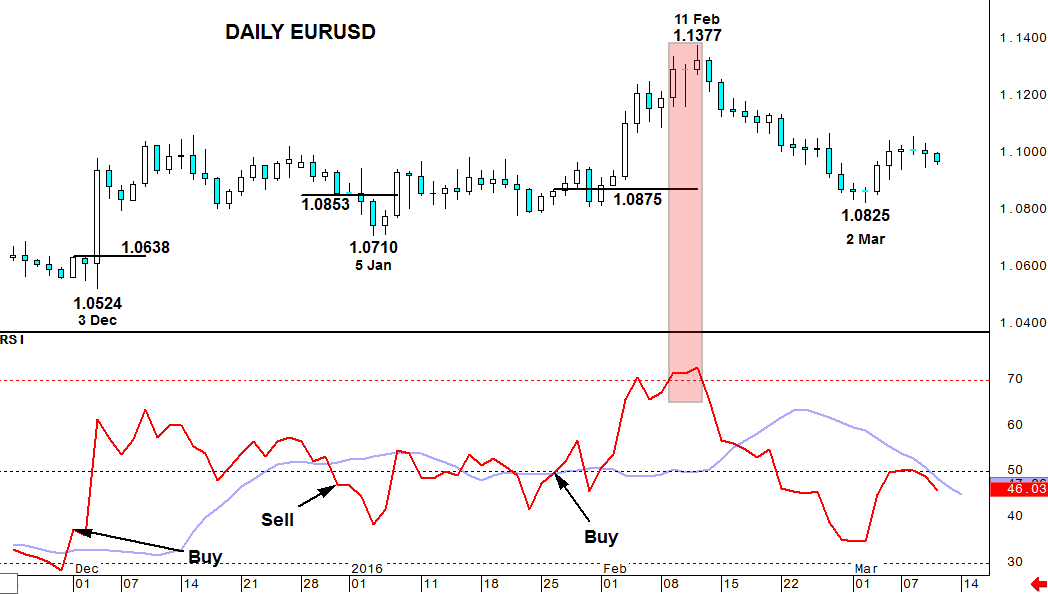
The next trigger given in the RSI crossover is towards the end of January where a positive call is confirmed with a move above 1.0875. Subsequent upside yields 5 big figures up to February’s peak.
There is no sell signal from a RSI perspective at those highs but as you can see below RSI signals are, for 3 days, above 70% which is a good overbought indicator.
In addition, the eagle eyed amongst you will have spotted a Bearish Engulfing pattern created by 12th February decline.
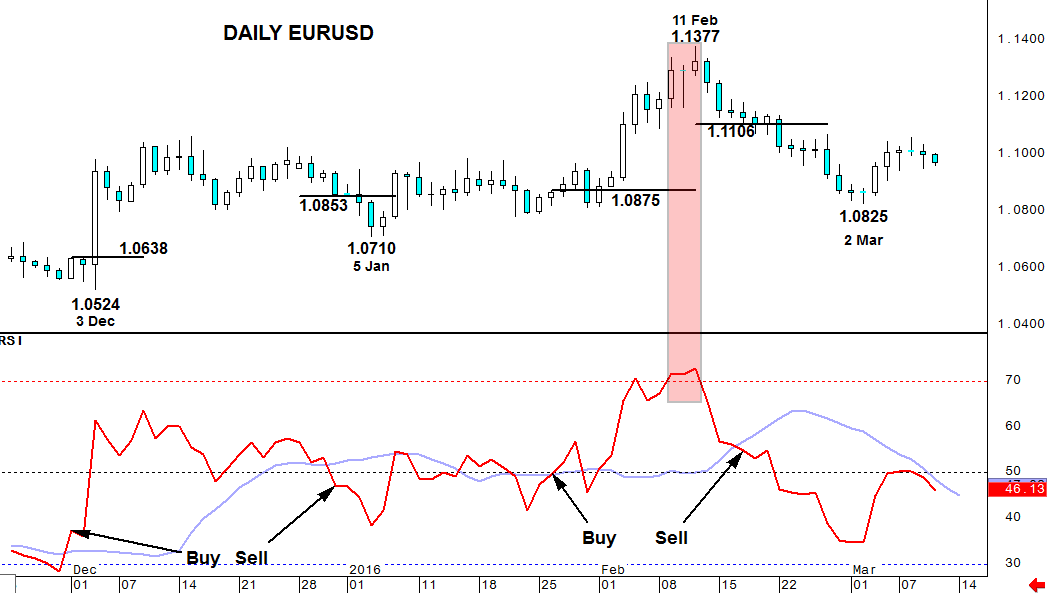
And finally one final downside trigger –
This was posted on Feb 17th where, despite the net decline on the day being minor, RSI levels broke below the moving average. Confirmation was a move below 1.1106 and the market has remained below that point since.
I hope you’ll be able to see the usefulness of using RSI in this way and that you’ll try it out for yourself in other markets.
The parameters used here are my own personal adaptation and I’d encourage some experimentation yourself but for those who’d like to have a starting point the RSI is a 13 day close and the moving average a 13 day exponential displaced (offset) by a further 8 days.
[youtube_sc url=”https://youtu.be/hSczeDA6Z-g” title=”Using%20RSI%20to%20trade%20EURUSD”]


