Posts tagged 'gold'

Courtesy of: Visual Capitalist All of the World’s Money and Markets in One VisualizationThis infographic is the updated version of our best-known piece from The Money Project, an ongoing collaboration with Texas Precious Metals. It was first published in late 2015.Millions, billions, and trillions…When we talk about the giant size of Apple, the fortune of Warren Buffett, or the... read more

Commodities in 2017 - Cheap against Equities?a guest article byJEFF DESJARDINSJeff Desjardins is a founder and editor of Visual Capitalist, a media website that creates and curates visual content on investing and business.WEBSITEIf you’re looking for action, the commodities sector has traditionally been a good place to find it.With wild price swings, massive up-cycles, exciting resource... read more

Longer-term signals have been bullish of Gold so far this year.The sell-off since the all-time high in 2011 at 1921.5 has attracted buyers back to the market in 2015 and 2016 from close to 1087.5. a key 50% pullback to the entire 2001-2011 ten year bull-run.Updates on 23rd January and 10th Feb have continued to highlight... read more

Chart: How Bitcoin Reached Parity With GoldCHARTING THE FAST AND VOLATILE RISE OF BITCOINThe Chart of the Week is a weekly Visual Capitalist feature on Fridays.Would you rather have one bitcoin, or a single ounce of gold?The answer used to be obvious. Even at the climax of the legendary 2013 rally, bitcoin was never able to... read more

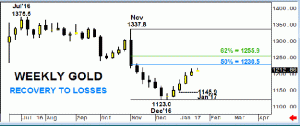
GOLD - Trades to 1st bullish target, potential for pullbackOur last update on the 23rd January continued to highlight our longer-term bullish stance on Gold.The sell-off since the all-time high in 2011 at 1921.5 has attracted buyers back to the market since last year's 1046.2 base, which is a key 50% pullback to the entire 2011-2011... read more

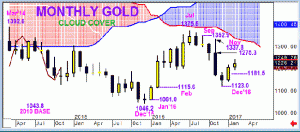
GOLD - testing 1st bullish targetA quarterly Shooting Star at last year’s high which had come from just below Ichimoku Cloud Cover and then the break of the Q3 low switched longer-term signals for GOLD to bearish in the last half of 2016. However, the subsequent sell-off has stalled from close to a 50% correction to the... read more

Courtesy of: Visual Capitalist 2016 Commodity PerformanceIt was an up and down year for commodities, but things ultimately finished in the black.The S&P Goldman Sachs Commodity Index (GSCI) climbed 10.1% on the year – it was just enough to edge out the S&P 500, which ended 2016 with a 9.5% return.WINNERS IN 2016The biggest winners on the... read more

Courtesy of: The Money Project All of the World’s Money and Markets in One Visualization How much money exists in the world? Strangely enough, there are multiple answers to this question, and the amount of money that exists changes depending on how we define it. The more abstract definition of money we use, the higher the number is. In this... read more

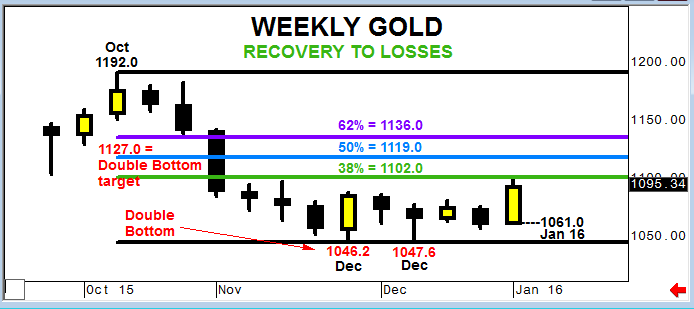
Longer-term signals for GOLD on our trend table had been bearish for some time, but a small monthly Doji candle in December at 6 year lows has also come from close to 1087.5, a key 50% pullback to the entire 2001-2011 bull market, switching signals going into January to neutral. However, this month’s strong open has... read more


