Posts tagged 'Ichimoko Cloud'

My Favourite Books on Technical Analysis.When I first got into Technical Analysis the only real way to learn was by reading books by those technicians that had started the ball rolling in modern times, and by playing with simple indicators on graph paper. The arrival of dealing room computers and then software accelerated the emergence of... read more
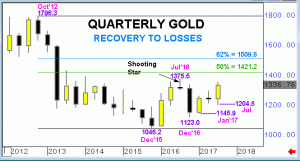
A 10 year rally in GOLD throughout the 2000’s has stalled:, but with deteriorating sentiment between 2011 and 2015 attracting buyers back to the market from close to 1087.5, a key 50% correction to the gains.Last year’s bounce has also stalled, - ahead of 1421.2, a 50% recovery to the 2012-2015 losses and a quarterly Shooting... read more
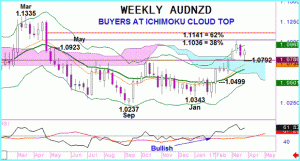
A positive cross in AUDNZD RSI, through it's average rate, was seen at the end of January. This was confirmed by a 'golden' cross in the spot rate in early February. This confirmed a bullish bias on our Trend Table.Prices rose almost 3 1/2 big figures after that - taking AUDNZD to 11 month highs, to... read more
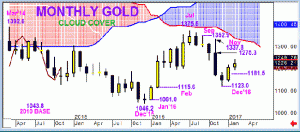
GOLD - Trades to 1st bullish target, potential for pullbackOur last update on the 23rd January continued to highlight our longer-term bullish stance on Gold.The sell-off since the all-time high in 2011 at 1921.5 has attracted buyers back to the market since last year's 1046.2 base, which is a key 50% pullback to the entire 2011-2011... read more
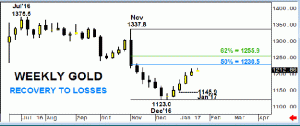
GOLD - testing 1st bullish targetA quarterly Shooting Star at last year’s high which had come from just below Ichimoku Cloud Cover and then the break of the Q3 low switched longer-term signals for GOLD to bearish in the last half of 2016. However, the subsequent sell-off has stalled from close to a 50% correction to the... read more
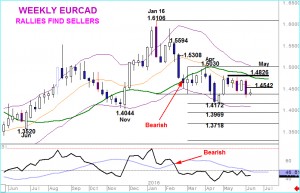
...Renewal of selling pressure has scope to take EURCAD to retest April lows.After EURCAD topped out in January, the following month saw a break of the RSI below it's moving average, then a move below the mid-point of the weekly Keltner channel and finally losses through the 21 week moving average. RSI signals have been negative since and although April... read more
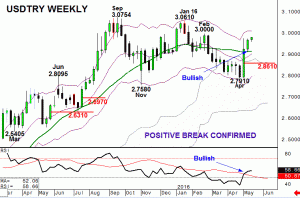
.....USDTRY fell 27 big figures from this year's top with the steady decline highlighted by a corresponding negative trend in RSI.In fact a move in RSI below it's moving average line warned of a change in investor sentiment well before confirmation the spot price. This bearish divergence was confirmed by January's peak being lower than last... read more


