Commentary
3c Analysis Commentary Page - Adding Value
On these pages we will expand upon some of our forecasts, talk about other moving markets from a technical analysis perspective, explain technical analysis tools from a practical perspective and include guest commentary from a variety of roles across the financial markets.

3cAnalysis Performance figures for May 2017 Below is a summary of the success of our daily calls for May 2017. These are broken down into an overview of percentage of directional success. May Apr Mar 2017 FX Majors 75.2% 70.5% 79.0% 76.8% FX Crosses 60.6% 66.0% 73.8% 69.7% Equities 73.2% 69.2% 76.7% 71.3% Fixed Income 88.0% 65.5% 71.2% 78.0% Total 74.3% 68.9% 75.4% 74.4% May % Win/Lose Best Class Fixed Income 88.0% 59/8 Best performers in class. USDCHF 85.7% 12/2 GBPCHF 71.4% 10/4 ESTOXX 90.0% 9/1 BUNDS 93.3% 14/1 Underperformer EURPLN 33.3% 3/6 Performance broken down into each asset class and their components. FX Majors MAY APR 2017 EURUSD 60.0% 58.3% 75.0% CABLE 81.2% 81.8% 79.2% EURGBP 75.0% 90.9% 76.4% USDJPY 72.7% 60.0% 69.0% EURJPY 84.6% 60.0% 67.3% USDCHF 85.7% 40.0% 83.9% USDCAD 78.6% 84.6% 85.7% AUDUSD 54.6% 66.7% 75.0% FX Crosses May Apr 2017 GBPCHF 71.4% 66.7% 73.7% EURSEK 66.7% 71.4% 71.4% EURNOK 66.7% 72.7% 68.7% GBPJPY 55.6% 50.0% 68.4% AUDJPY 58.3% 40.0% 66.7% EURPLN 33.3% 85.7% 68.9% Equities May Apr 2017 DAX 81.8% 87.5% 81.1% ESTOXX 90.0% 66.7% 80.9% FTSE 71.4% 62.5% 73.8% DOW 55.6% 66.7% 61.9% S&P 60.0% 75.0% 62.8% NASDAQ 77.8% 60.0% 63.4% Fixed Income May Apr 2017 BUNDS 93.3% 66.7% 78.6% BOBLS 86.7% 72.7% 79.2% GILTS 85.7% 64.3% 76.1% T-NOTES 80.0% 55.6% 75.0% 30 yr 92.3% 66.7% 80.6% Any opinions, news, research, analysis,... read more

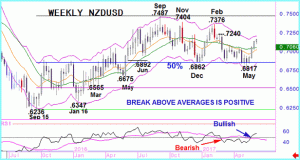
Last week saw a strong move higher in NZDUSD that confirmed a break of key moving averages in both spot NZDUSD and the RSI indicator. This change to a bullish tone comes after February's negative move yielded only limited downside. Importantly that decline stalled at a 50% correction to the Sep'15 to Sep'16 rise - just as... read more

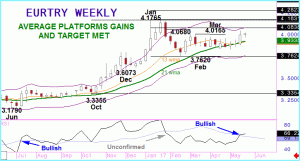
Our assessment of the trend for EURTRY has been bullish since July 2016 after the spot crossover of the 21 week moving average (a golden cross) confirmed a marginally earlier cross in our RSI indicator.Throughout the latter part of 2016 and the beginning of this year, those averages, and even the 13 week line, have supported... read more

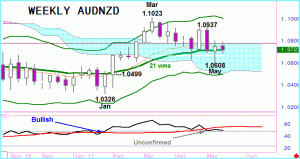
A positive move through the 21 week moving average in AUDNZD in February confirmed a similar move in RSI the previous week.The year's peak was reached during March and the market has slipped back since - crucially to that moving average which, despite spikes below, has held the downside for AUDNZD on a closing basis over... read more

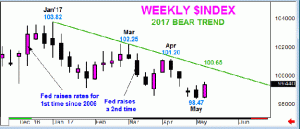
Historically, anticipation of rising US rates has supported the US$. However, in a classic case of rumour over fact, once those rate rises have been implemented the US$ usually reverses.This year's signals on the $Index have been bearish and are supporting this view. Sellers have returned to the market.at 14 year highs and from close to... read more


