Commentary
3c Analysis Commentary Page - Adding Value
On these pages we will expand upon some of our forecasts, talk about other moving markets from a technical analysis perspective, explain technical analysis tools from a practical perspective and include guest commentary from a variety of roles across the financial markets.

3cAnalysis Performance figures for February 2017Below is a summary of the success of our daily calls for February 2017. These are broken down into an overview of percentage of directional success. FebJan2017FX Majors77.1%80.6%78.9%FX Crosses72.5%75.0%73.6%Equities61.8%75.6%68.0%Fixed Income85.3%79.2%82.1%Total75.0%78.2%76.6% February %Win/LoseBest ClassFixed Income85.3%58/10Best performers in class.EURUSD100%9/0GBPCHF92.3%12/1ESTOXX88.9%8/1t-notes92.8%13/1UnderperformerS&P28.6%2/5 Performance broken down into each asset class and their components.FX MajorsFebJan2017EURUSD100%86.7%91.7%CABLE80.0%66.7%73.3%EURGBP60.0%78.6%69.0%USDJPY72.7%75.0%73.9%EURJPY58.3%66.7%61.9%USDCHF92.3%92.9%92.6%USDCAD86.6%86.7%86.7%AUDUSD66.6%88.9%80.0% FX CrossesFebJan2017GBPCHF92.3%63.6%79.2%EURSEK66.6%77.8%71.4%EURNOK50.0%69.2%60.0%GBPJPY73.3%88.9%79.2%AUDJPY85.7%72.7%77.8%EURPLN70.0%85.7%76.5% EquitiesFebJan2017DAX69.2%100%80.6%ESTOXX88.9%88.9%88.9%FTSE87.5%42.9%66.7%DOW40.0%100%62.5%S&P28.6%75.0%53.3%NASDAQ50.0%50.0%50.0% Fixed IncomeFebJan2017BUNDS92.3%64.3%77.8%BOBLS73.3%78.6%75.8%GILTS90.9%85.7%88.0%T-NOTES92.8%85.7%89.3%30 yr80.0%81.2%80.6% Any opinions, news, research, analysis,... read more

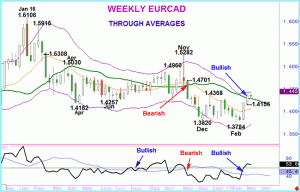
A sharp decline in EURCAD in mid-November ended a period of volatile but trendless trading around the 13 and 21 week moving averages. That fresh negative bias for the cross yielded more than 5 big figures to this year's low. But the EURCAD decline was not an aggressive one but the rally from last month's bottom has... read more

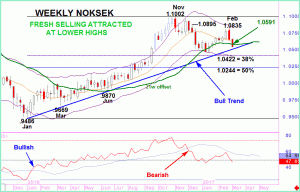
Trading this year in NOKSEK has given some mixed signals after last year's clear and aggressive upside.Profit taking from November's peak above 1.1000 led first to a negative cross in our RSI indicator during December then followed in January with a cross of it's 21 week offset moving average. But that confirming move move proved a... read more

Chart: How Bitcoin Reached Parity With GoldCHARTING THE FAST AND VOLATILE RISE OF BITCOINThe Chart of the Week is a weekly Visual Capitalist feature on Fridays.Would you rather have one bitcoin, or a single ounce of gold?The answer used to be obvious. Even at the climax of the legendary 2013 rally, bitcoin was never able to... read more

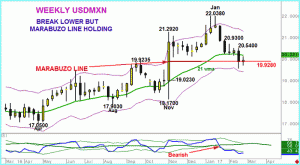
USDMXN was in a broad up trend throughout 2016 with an acceleration after Trump's election. But profit taking has been the dominant feature since January's peak above 22.0000 and last week's decline took prices below the 21 week moving average.That point was breached last October and August but trading below that point was temporary and limited. Will... read more


