Posts tagged 'Sterling'
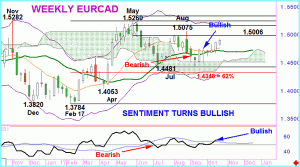
Our Quarterly USDCAD view is a bullish one and is currently being driven by a weaker CAD across the board. That is reflected in positive moves last week in EURCAD and GBPCAD that confirmed a medium term bullish tone for these crosses.In EURCAD the spot price has been flirting with the 21 week displaced moving average... read more
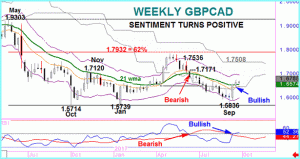
Last week's gains in GBPCAD were more modest than the previous week's upside but they were enough to confirm a change in investor sentiment to bullish.This is because this improvement took GBPCAD above the 21 week moving average for the first time in 3 months. Importantly that break confirmed a similar 'golden' cross of our RSI... read more
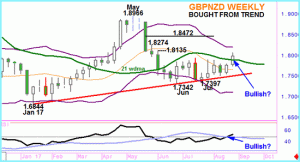
GBPNZD is testing a key weekly level. The 21 week displaced moving average has a history being an excellent medium term trend indicator and the spot price is, currently, trading back above. This is backed up by a similar, potential, 'golden' cross in our RSI indicator.GBPNZD gained more than 21 big figures from January's low but... read more
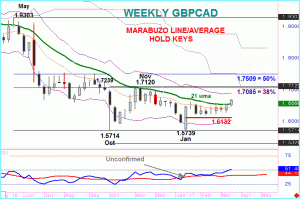
Update - Monday 27th MarchAs mentioned last week the key level for this currency pair is/was the 21 week moving average and last week's demand has taken GBPCAD above that point. This confirms the positive cross already made in the RSI indicator with targets as below. I wrote last month about how there were warning signs for... read more

Have you ever wondered which currencies receive the most trading action? The data for the following chart comes from a survey done every three years by the Bank of International Settlements (BIS).Note that trading volume adds up to 200%, because each currency trade has a pairing.Chart courtesy of: DatashownThe Chinese yuan is now the 8th most... read more

Project Fear - Implications of Brexit... a guest article.by Jeremy RaybouldPrivate Equity and Alternative Investments Specialist/Investor Relations and Equity Fund Distribution. Partner at Lancea LLP Brexit and Binary: when it is or when it isn't - or neither?The UK's EU referendum is, on the face of it, a binary event: either yes or no. Either of the 50:50... read more
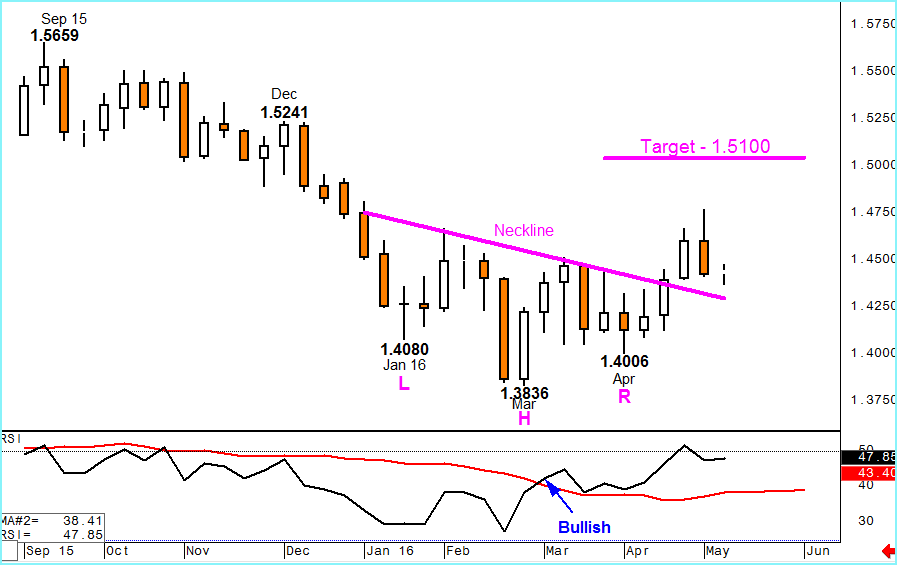
....The background to medium term analysis to CABLE has to be the bullish inverse Head & Shoulders pattern that the chart below shows.This year's trading has been dominated by downside attempts in January, March and April that formed the three bases that create the Head & Shoulders formation. This pattern very often confirms a strong change... read more
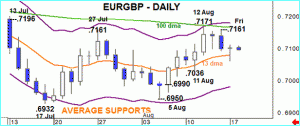
Against a background of bearish signals for sentiment for this week, yesterday saw EURGBP sold to lower levels for a 3rd day in a row. But the lows, beneath the key 13 day moving average were not held and the renewal of investor demand left prices virtually unchanged into the close. That normally signals investor uncertainty... read more
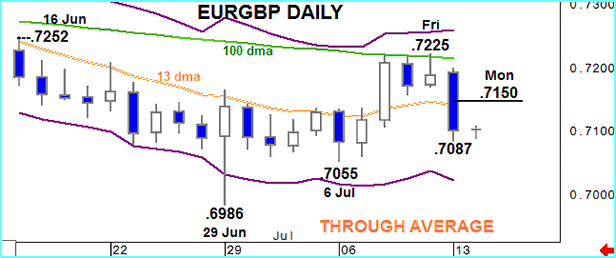
Last week's stalling at the 100 day moving average is proving the key element to trading. That failure to break higher has now translated into significant selling pressure that has taken EURGBP back below the key 13 day moving average. The scope of the move – almost 1 big figure – means sentiment is overstretched but... read more
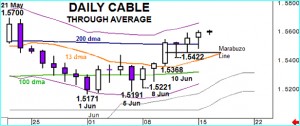
A sequence of 3 lower CABLE highs ended last week. The preceding week's stalling at a 50% correction level proved crucial and as buying became more pronounced. In fact gains of almost 3 big figures turned weekly sentiment clearly positive, especially with the market bought at higher levels on each of the last 6 days and... read more


