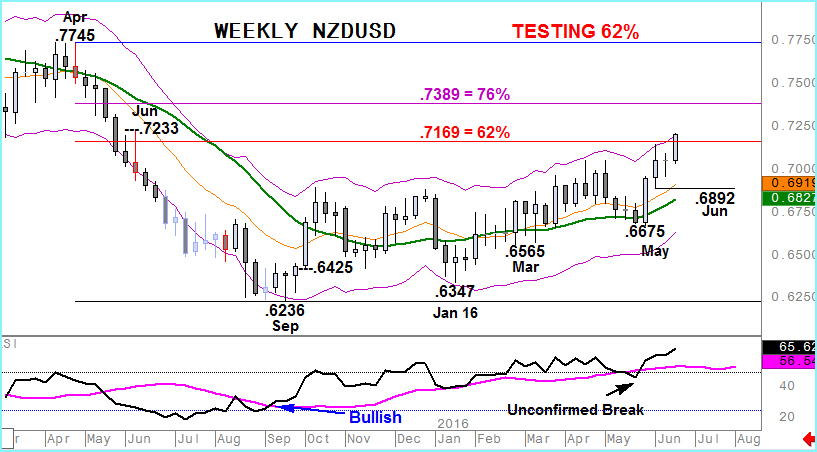
NZDUSD – Still Bullish (update)
23rd June 2016
….I wrote 2 weeks ago about bullish sentiment for NZDUSD. That view was based upon prices remaining above the 21 week moving average, positive RSI signals (above its own average) and bullish DMI signals.
Price action had just tested those indicators and rejected a potential change to bearish with the subsequent strong renewal of buying again testing a 50% retracement of the April-September 2015 decline. And we were targeting the .7169/.7233 area for NZDUSD.
 This week’s strong rise has confirmed that call with a move into this key area. I’ve updated the charts and added a DMI Difference indicator on the second one. That signal not only remains positive but is actually accelerating and has reached the most positive levels since October 2009.
Overbought extremes are a growing concern but we continue to look for NZDUSD setbacks, perhaps towards .6892, to be attractive to investors. A weekly close above .7169 should therefore focus the market on a broader 76% point at .7389 in the coming weeks.


