
We agree with the Saxo & Blackrock views in this intersting article.Please click... read more

Longer-term 3 month signals have been bullish throught 2019 and our strategy to stay long and buy dips has been the correct one.However, although there is no clear bearish reversal pattern on longer dated DAX-FTSE charts, signasl in the shorter-end are highlighting warnings.Initially divergence on momentum indicators, last week the US ending long trend of higher... read more
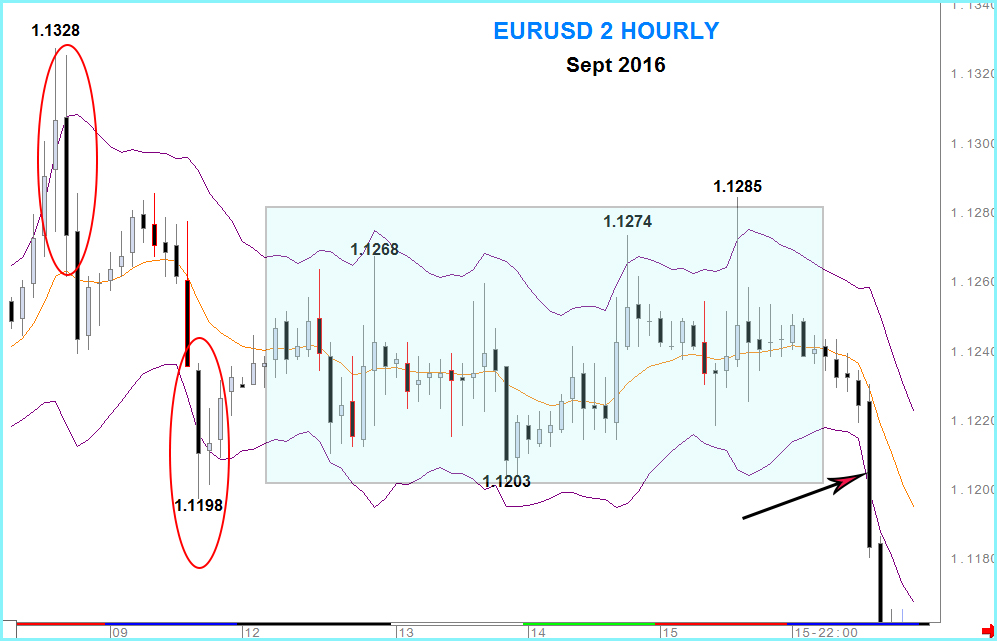
This article is about Keltner channels and how, using them as trend indicators, they can aid trading on almost any time scale.Firstly we’ll cover the theory then practice of how I use them in analysis across the asset classes with some recent examples to see how they work.Keltner channels can be invaluable as a tool for... read more
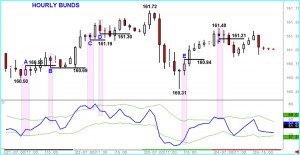
I've pointed out on these pages before how useful both RSI and Keltner channels can be to traders across the asset classes. What I'd like to show today is how the two indicators can combine in another method of application for trading. This article is going to look at using Keltner channels around the RSI indicator rather than... read more

For the first time since last August, our trend following signals for AUDNZD have turned bullish.Last year's peak in August was signals by a Bearish Dark Cloud cover pattern on weekly candle charts. That bearish pattern was followed, 2 weeks later with a negative 'dead' cross of the 21 week moving average and a matching cross... read more
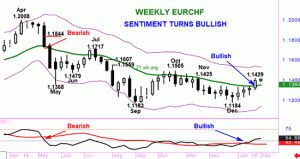
Last week saw investor demand for EURCHF continue the rise from last year's low point. But the key element was that buying interest accelerated - creating a 4th up week in a row and, more importantly, breaking above the 21 week moving average.That positive break confirms the 'golden' cross already provided in the EURCHF RSI signals... read more
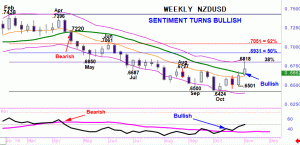
Last week's investor demand yielded a 4th positive weekly performance from the last 5. Importantly, the move took NZDUSD to the most positive levels traded for 14 weeks, breaking above the trend defining 21 week moving average.This confirms a similar bullish cross in the NZDUSD RSI indicator that occurred 3 weeks previously.A change to a bullish... read more
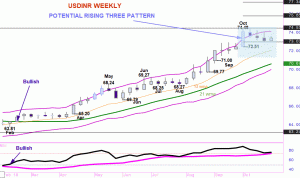
In the middle of February, buying if USDINR created a positive crossover of the 21 week mvg avg. This move confirmed a marginally earlier ‘golden’ cross in our RSI signals.Overall that bullish signal has been intact since with USDINR climbing by 9.50 or 14.75%, despite some profit taking during May and July- August. But you can... read more
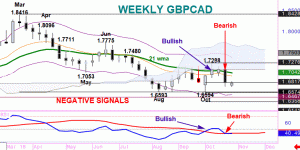
Updated 29th October.Contrary to the bullish signals generated 2 weeks ago, investor demand for GBPCAD could not be maintained. Instead selling interest was renewed with last week's decline being the most negative GBPCAD performance since April. This is enough to reassert a Bearish bias with initial targets of 1.6574 and 1.6467.Last week saw solid gains in... read more
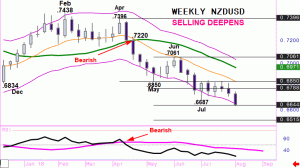
Overnight news from the RBNZ has hit the Kiwi. Actually it has only emphasised a weakness that was already there as we can see with a look at 2 of the currency pairs in our Trend Table.Our medium term bias for NZDUSD has been negative since April when a 'dead' cross in the spot through the 21... read more


