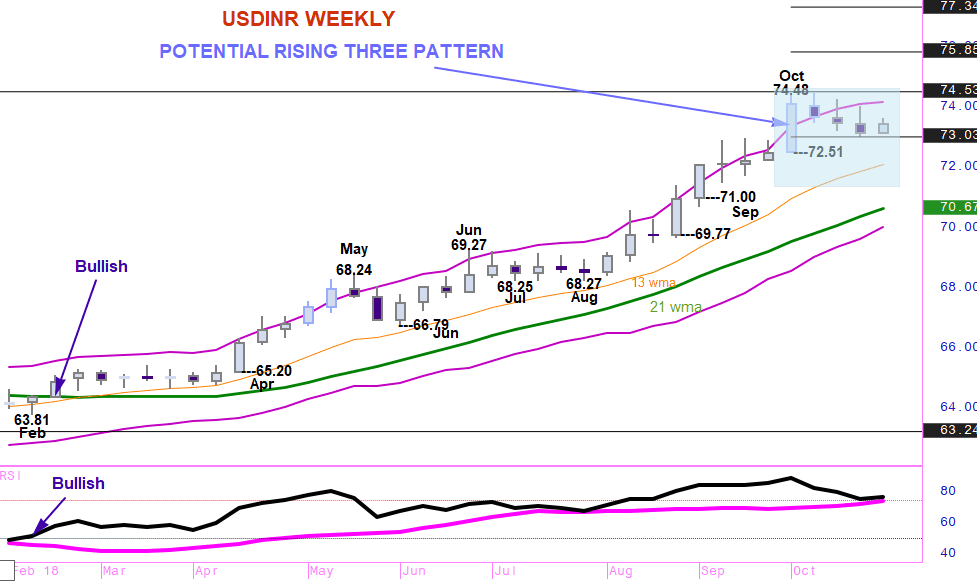
USDINR – Potential Bullish Rising Three pattern developing
29th October 2018
In the middle of February, buying if USDINR created a positive crossover of the 21 week mvg avg. This move confirmed a marginally earlier ‘golden’ cross in our RSI signals.
Overall that bullish signal has been intact since with USDINR climbing by 9.50 or 14.75%, despite some profit taking during May and July- August. But you can see from the chart that although the RSI slipped back near to its average, spot USDINR has not even tested the 13 week line.
The last 3 weeks have seen prices fall from October’s peak though with 3 down weeks in a row – the most negative sequence since the bull trend began – but interestingly and importantly the setback has lacked enough momentum to reverse the net gains posted in the first week of this month.
That weakness of selling pressure is, in our assessment, emphasising the underlying positive tone for USDINR sentiment and creating the potential for a Bullish Rising Three pattern on weekly candle charts. To confirm this a weekly close above 74.13 is needed which should result in an upward USDINR acceleration to 75.85 and 77.34.


