
Posts tagged 'Doji'
GOLD – Double Bottom Low at Key 50%7th January 2016
Longer-term signals for GOLD on our trend table had been bearish for some time, but a small monthly Doji candle in December at 6 year lows has also come from close to 1087.5, a key 50% pullback to the entire 2001-2011 bull market, switching signals going into January to neutral. However, this month’s strong open has... read more
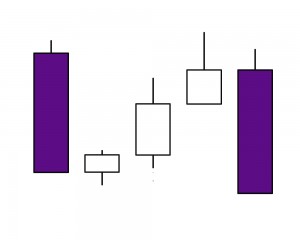
Continuation Candle Patterns7th August 2015
There aren’t many analysts out there that don’t now use candlestick charts as opposed to bar charts. The reason is quite obvious once you’ve seen a candle chart and it is that they offer everything a bar chart does but with the added value of graphically showing the key open and close. This immediately helps to... read more