Continuation Candle Patterns
7th August 2015
There aren’t many analysts out there that don’t now use candlestick charts as opposed to bar charts. The reason is quite obvious once you’ve seen a candle chart and it is that they offer everything a bar chart does but with the added value of graphically showing the key open and close. This immediately helps to understand the underlying tone of the market and also, by means of the formations we will cover, gives clues as to the market’s direction.
Continuation Patterns
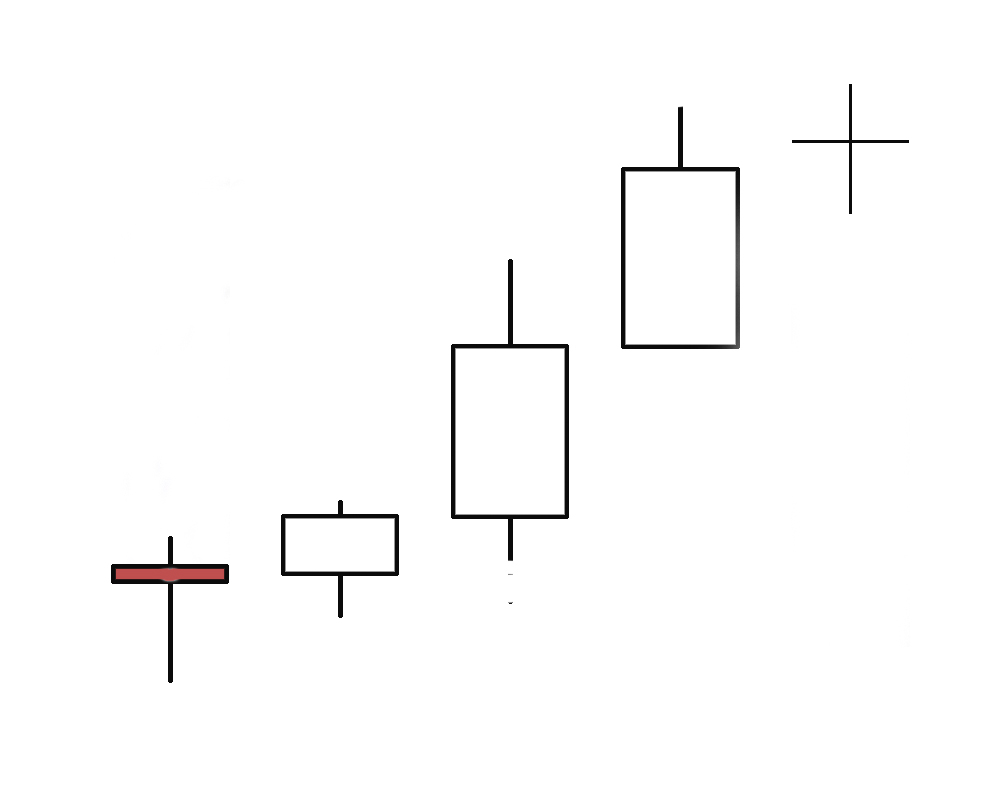
The key element here is the context which this pattern is presented. An up trend must be present ahead of some consolidation, then renewal of demand signalled by the 3 white soldiers.
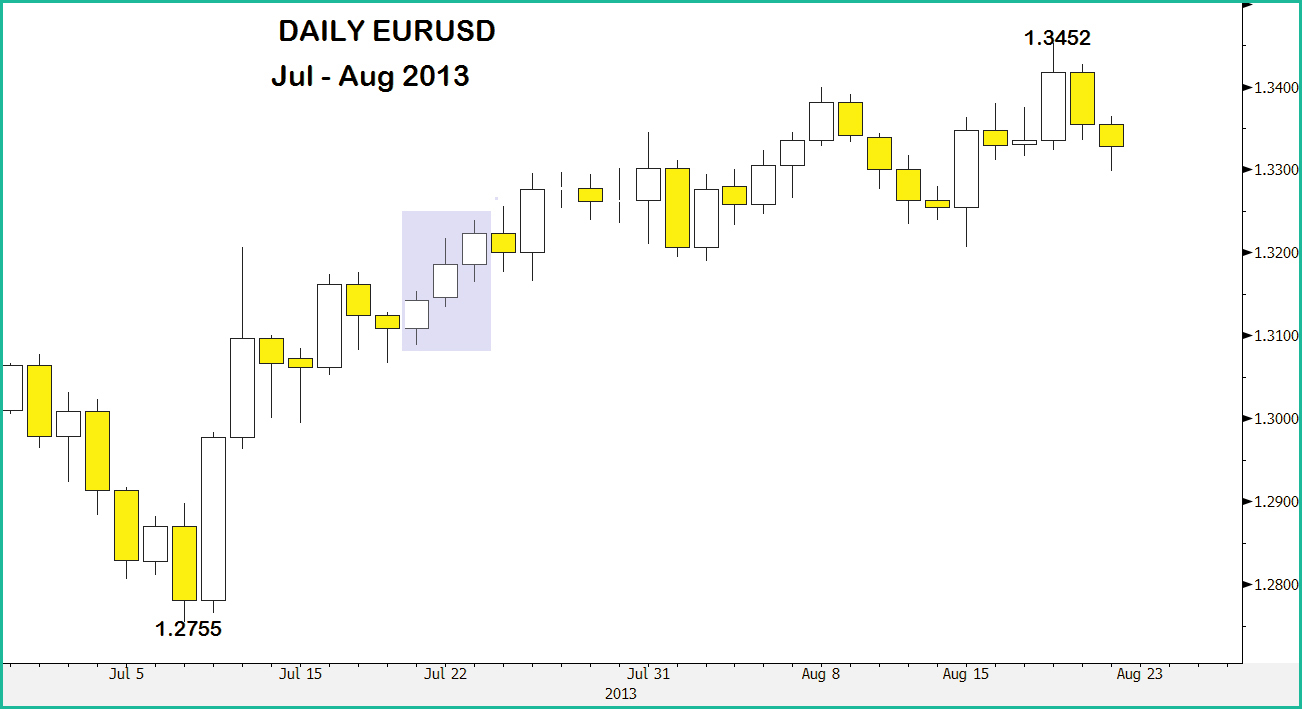
Here is a very good illustration of the 3 White Soldiers – sandwiched between 2 minor setbacks but inside an established trend this formation in EURUSD clearly indicates that the underlying trend is intact.
Perspective is covered elsewhere but it certainly helps in this case to confirm the context that the 3 White Soldiers appears.
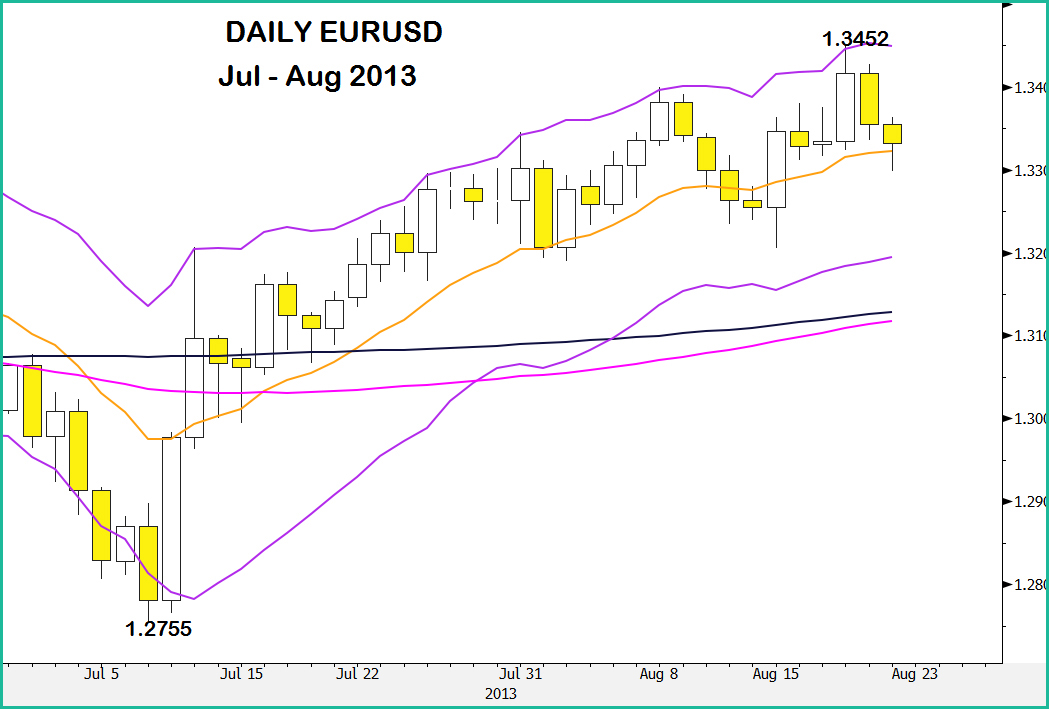
Here the move is contained within a positively trending Keltner channel, is supported by the 13 day moving average and has recently crossed both the 100 & 200 day averages.
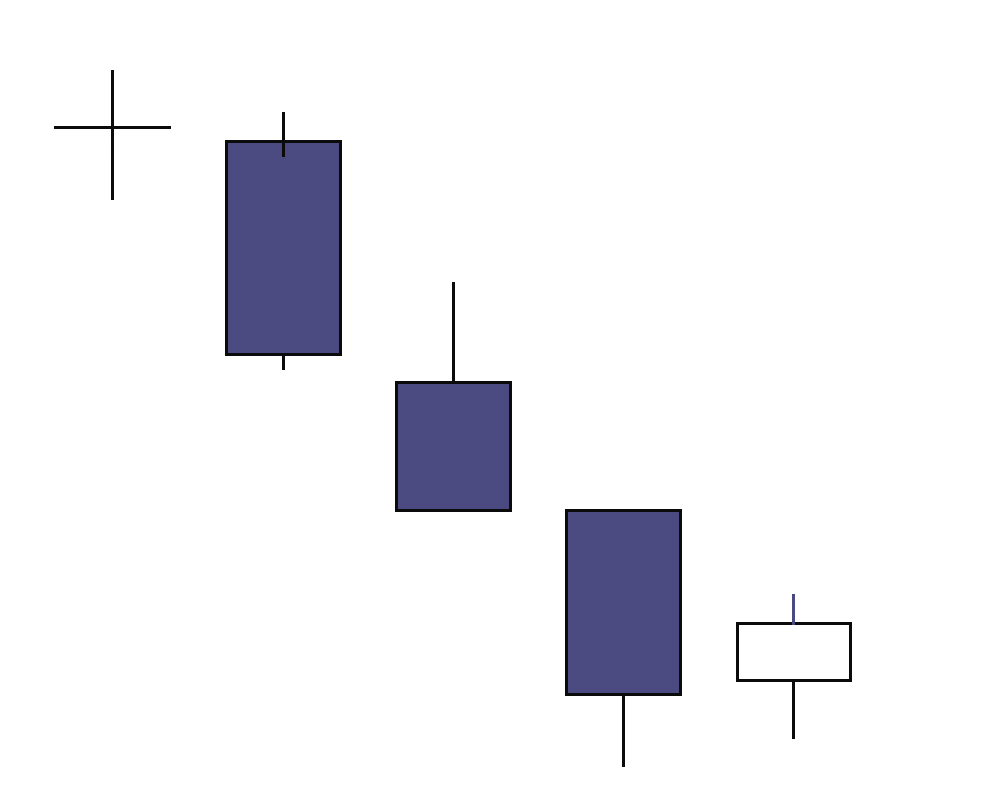
The title is 3 Black Crows, and as you can see from the above it is graphically describing 3 periods of strong selling. But some leeway has to be given as the sequence may be 2 large declines or even 4.
The key element is that within an established move lower some hesitation, minor profit taking, is followed by a renewal of the downside signalled by this candle pattern.
Here there is a minor rally that stalls and produces a Doji pattern. The indecision that that candle suggests is resolved by a renewal of selling pressure that yields the 3 Black Crows. This continuation pattern bears fruit after a very minor up move again fails.
 As we’ve mentioned before on these pages, and will do again no doubt, the key to al technical analysis is context and the 3 Black Crows mentioned above can be seen in context here.
At the beginning of the formation prices are topping at the middle of a gradually declining Keltner channel. By the time the pattern is confirmed with the 3rd negative day in succession, the market is tracking the lower end of a more aggressively falling channel. As we’ve seen when looking at Keltner channels, this is a clear sign of a trending market.
The continuation aspect is proved by the price continuing to decline over the subsequent 6 days.
Doji patterns are love/hate candles. Many swear by them, others find them tougher to read. I’ve mentioned perspective before and where Dojis are formed it is vitally important to only place emphasis when it fits into the underlying scenario. Overall Doji patterns can be formed by minor net movement, positive or negative, but the nearer to an unchanged open to close the more they fit the theory. What they immediately signify is market indecision – both the upside and the downside has been tested but rejected. This is quite straightforward but this is where the perspective comes in. Doji patterns are often formed in quiet periods and it is then that their relevance has to be viewed as reduced. But when formed in normal market conditions then the key to their impact is what price action has preceded the formation. They are certainly a point where some thinking has to be done.
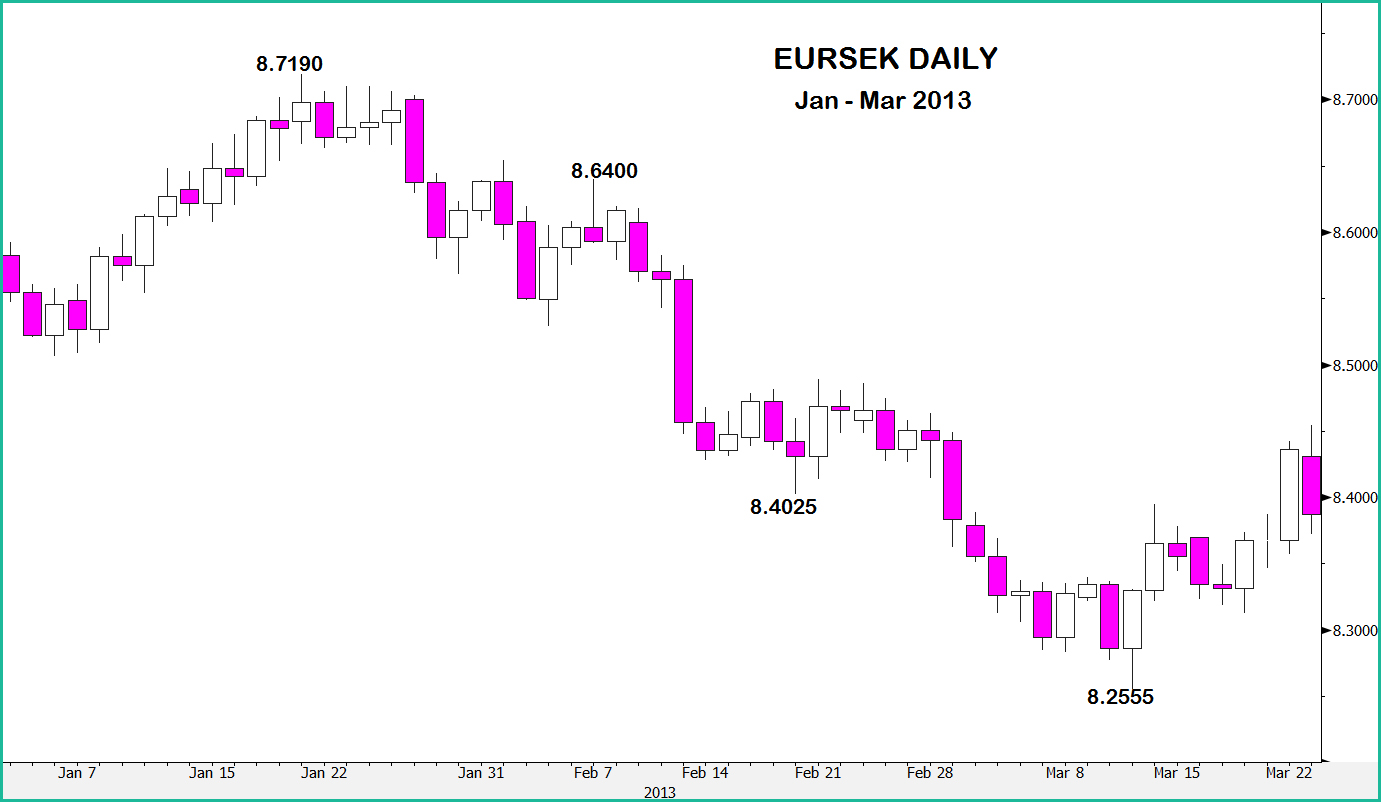
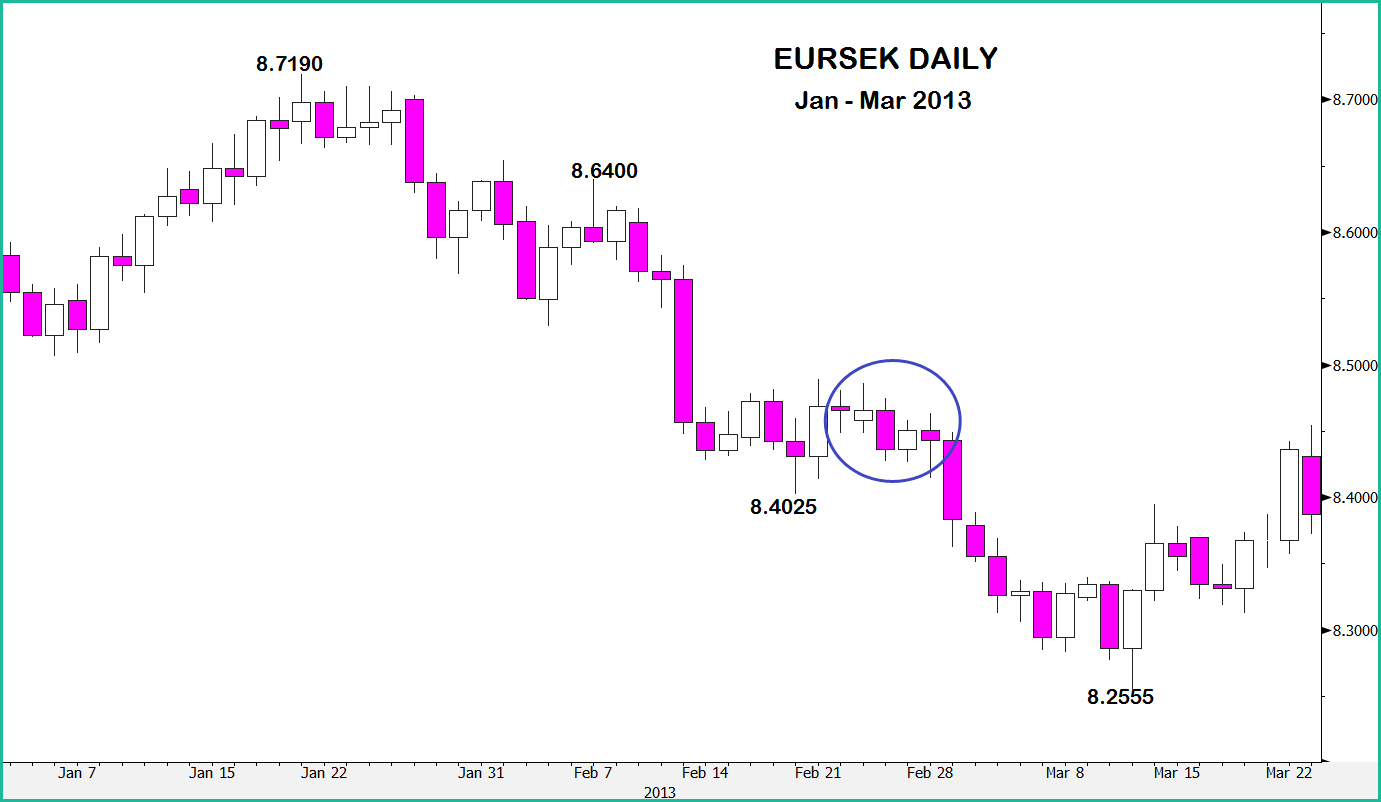
We’re going to look at a few examples of Doji patterns created inside a couple of months of daily candles in EURSEK.
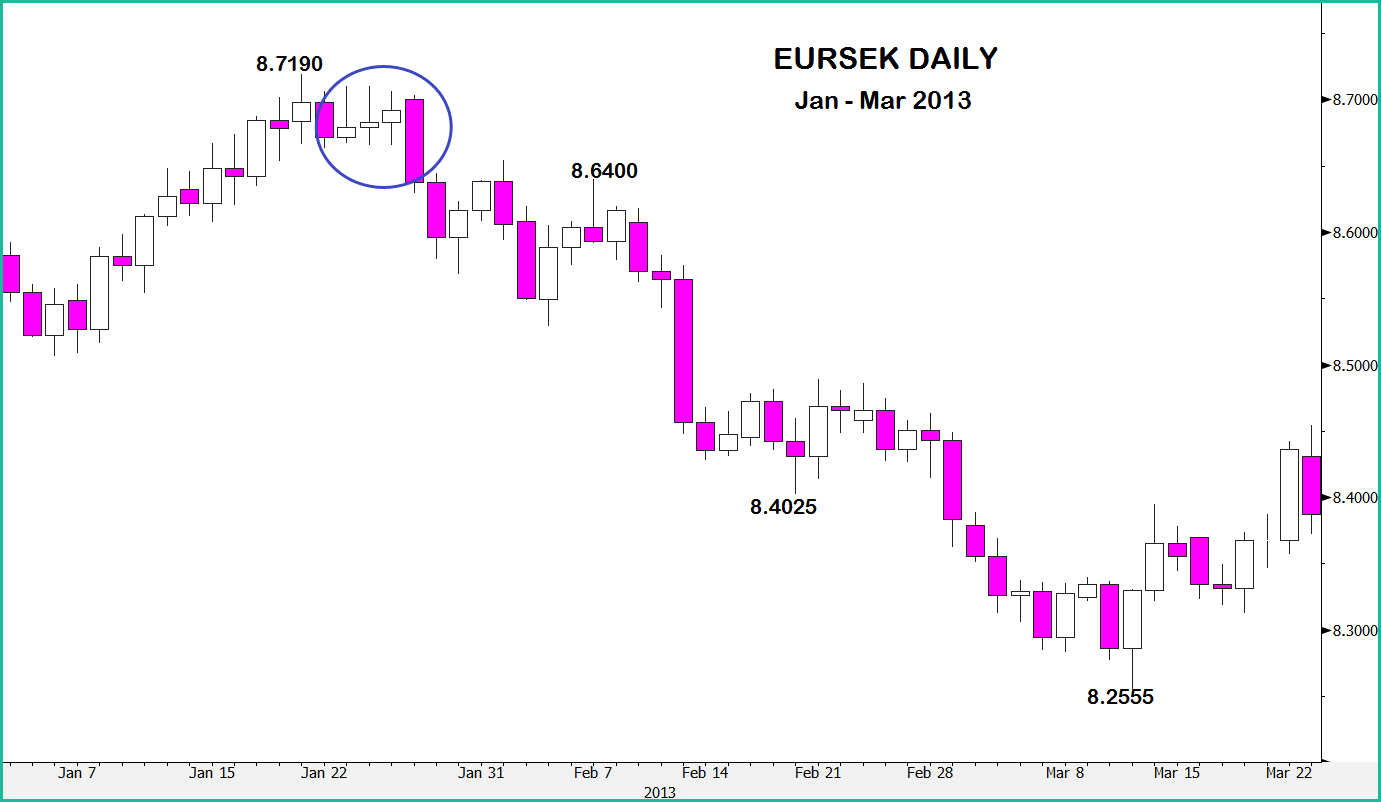
The first comes in after the market has risen steadily and other factors are probably already overstretching and sending out some warnings (perspective). EURSEK then 3 consecutive Dojis. They’re not perfect as the bodies are larger than ideal, but again referring them to the preceding decline they show a weakness that is then confirming by the following decline that is strong and leads to losses – eventually, of more than 46 big figs (5%).
The 2nd example is after the market has fallen a significant distance and there is a period of consolidation/profit taking. At the time its not clear whether a base is forming or hesitation before the decline is renewed.
2 Dojis are formed during this period – the 2nd, despite being long legged is the final day of indecision before a break of that day’s low indicates that the underlying trend has reasserted.
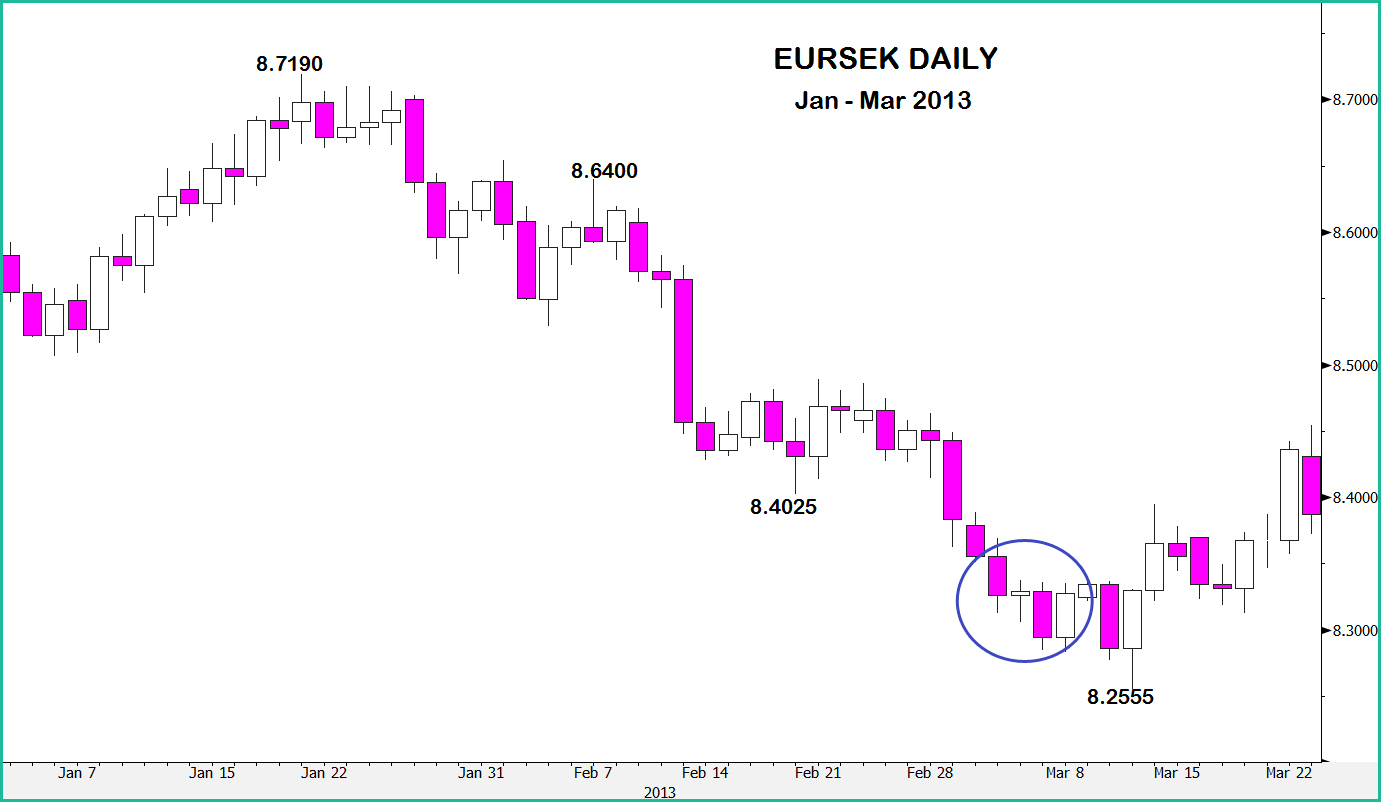
This example, at the time, would have been expected to be a warning for sellers coming, as it did, after some a long decline. However, although the lows weren’t far off there was no confirmation at the time and so the actual lows were signalled by 2 Bullish Piercing patterns.
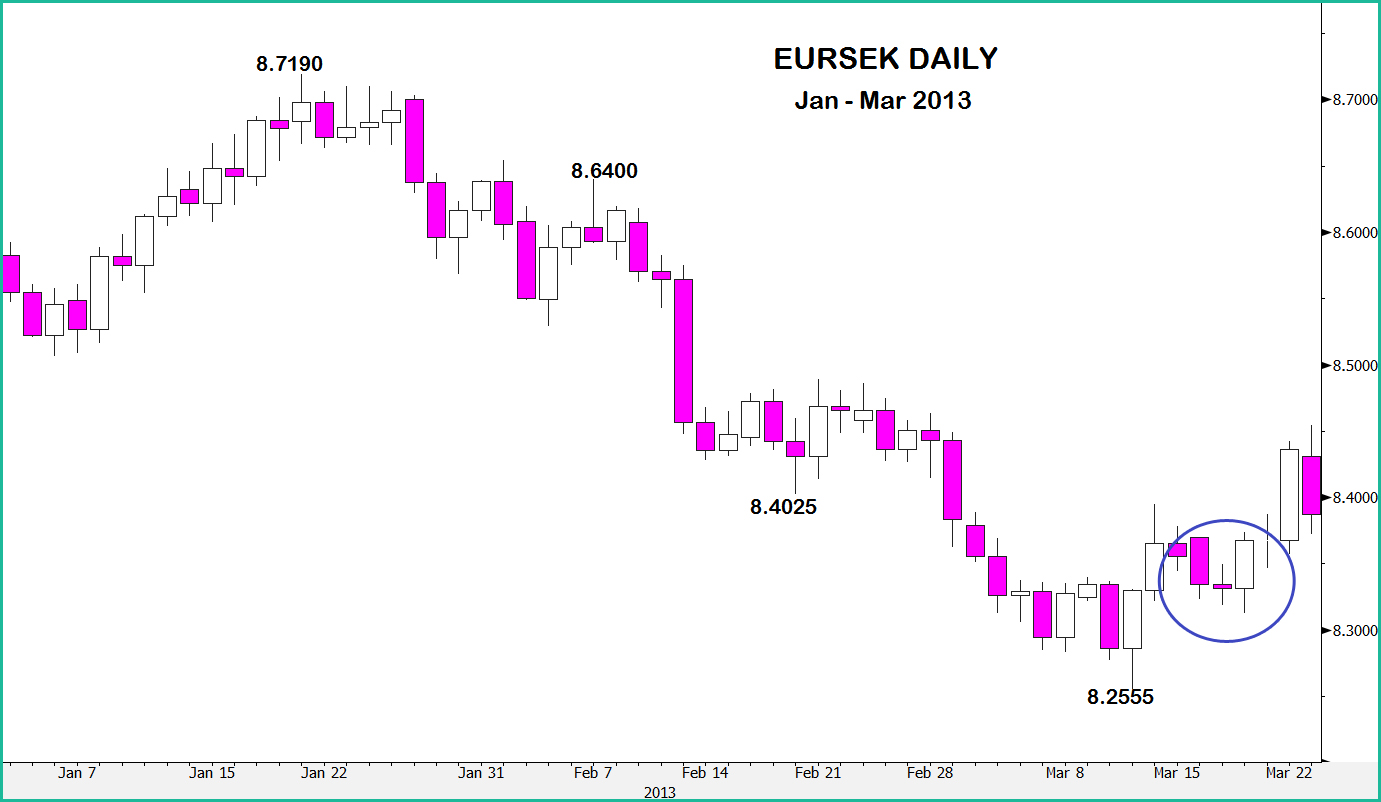
Finally, the cross is on the way up and the market hesitates; is it a real rally or a false one. The Doji, followed by confirming demand makes it clear that this upside is the real thing.
Long Legged Doji
![]()
It only takes one look to see the difference in this Doji pattern.
Both the high and low have been rejected for an unchanged, or almost unchanged, open to close but this time the low was a deep one and unsurprisingly, although the lack of net movement highlights uncertainty, it is the bounce that is most likely to have the impact. Of course this greatly depends on the price action that preceding this period.
Gravestone Doji
![]()
Here we have the complete opposite of the Long Legged Doji with the gains being much greater than the losses and so it is the upside rejection that is likely to have the greater impact on prices going forward.
Once again it is context that is the key thing before assessing the possible movement.
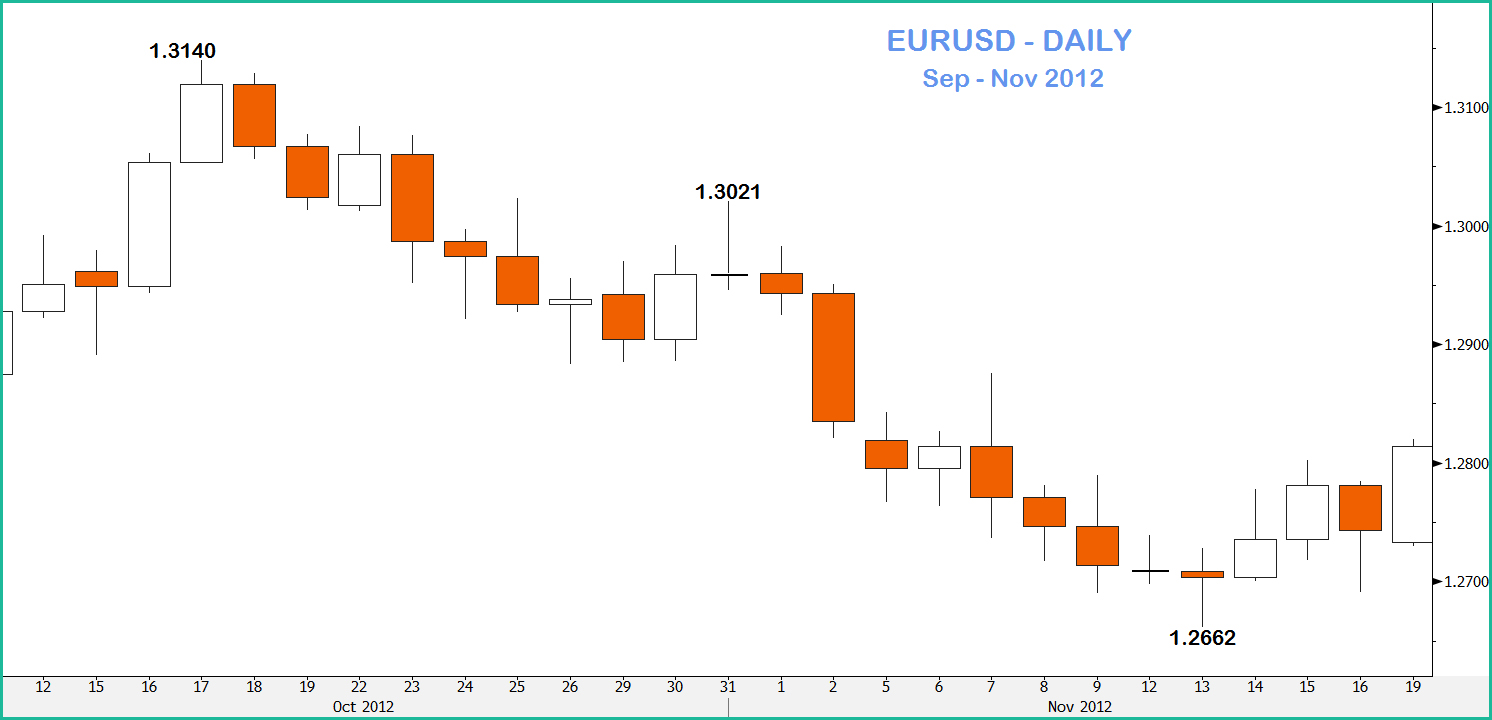
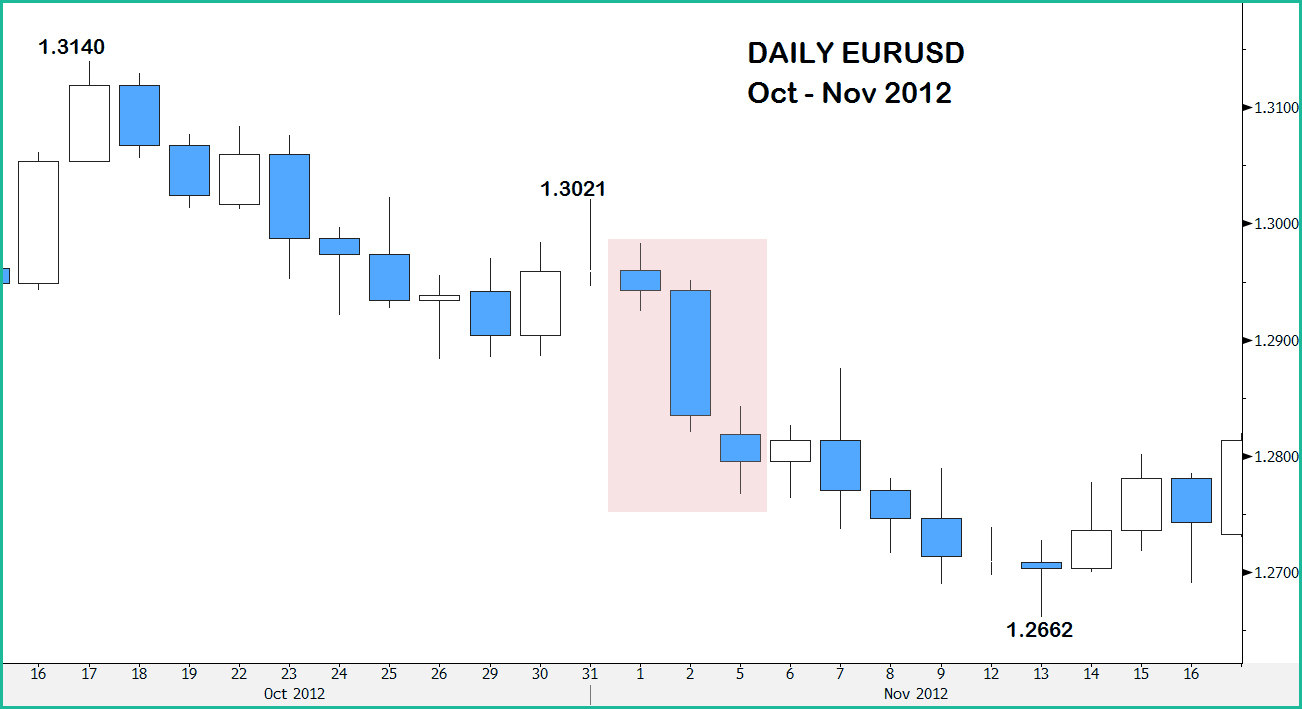
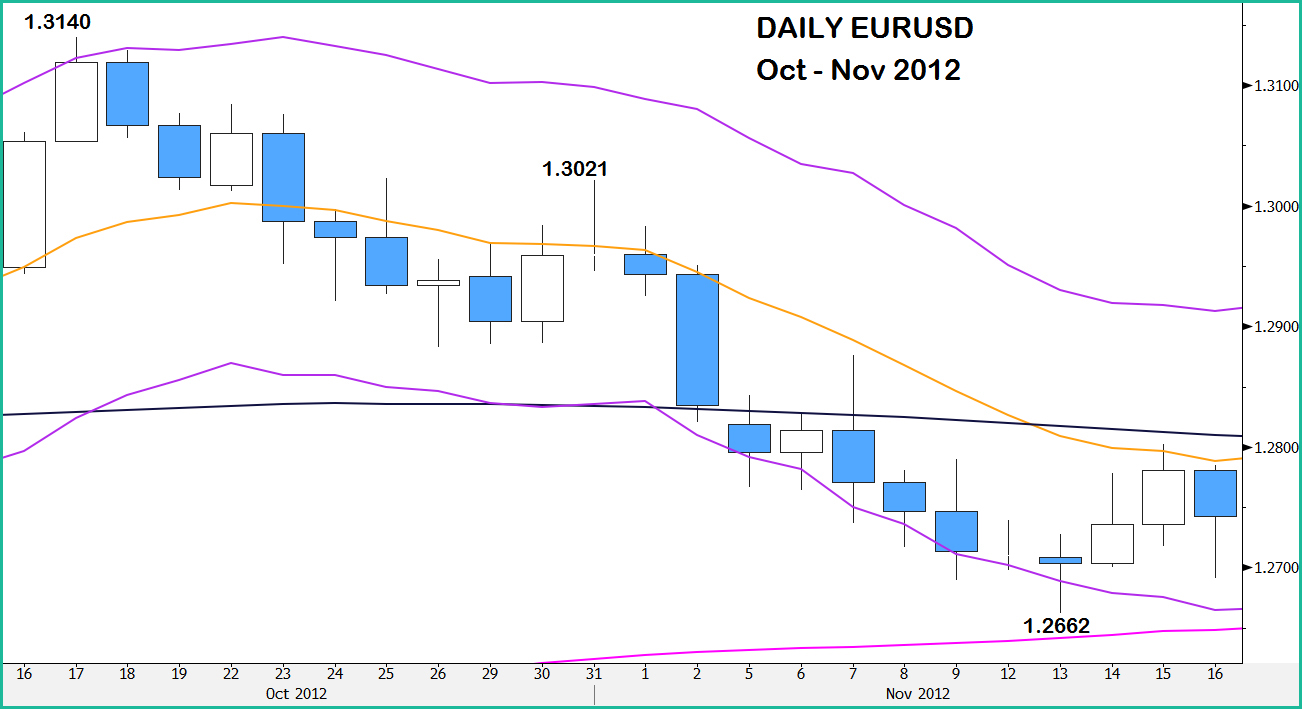
Here we have a chart of a steady decline from Sept to Nov 2012. 3 Doji patterns occur.
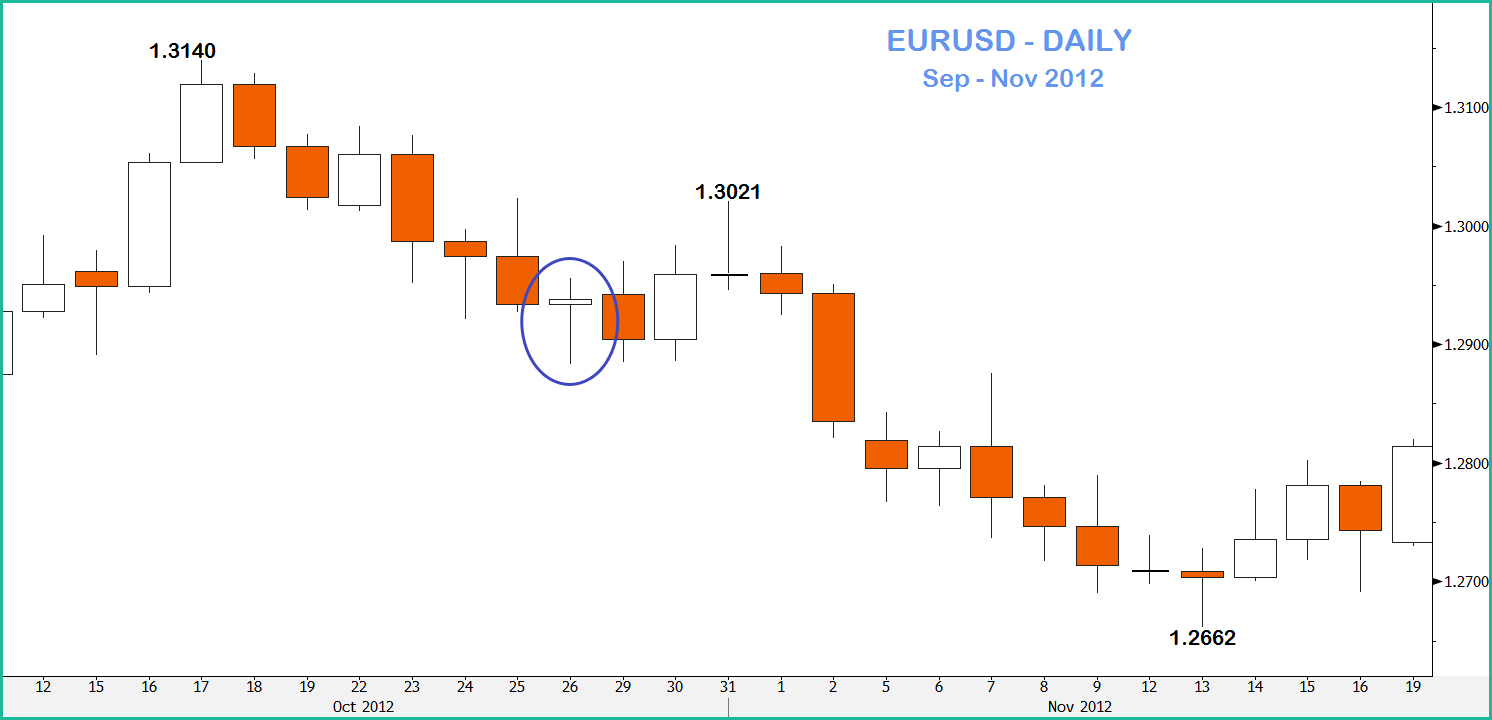
The first is a Long-Legged Doji that comes after a significant decline. The downside rejection, similarly to a Bullish Hammer, suggests a rally, or end to the decline. This seems to be confirmed by the Bullish Engulfing pattern 2 days later. But while higher levels are briefly seen …..
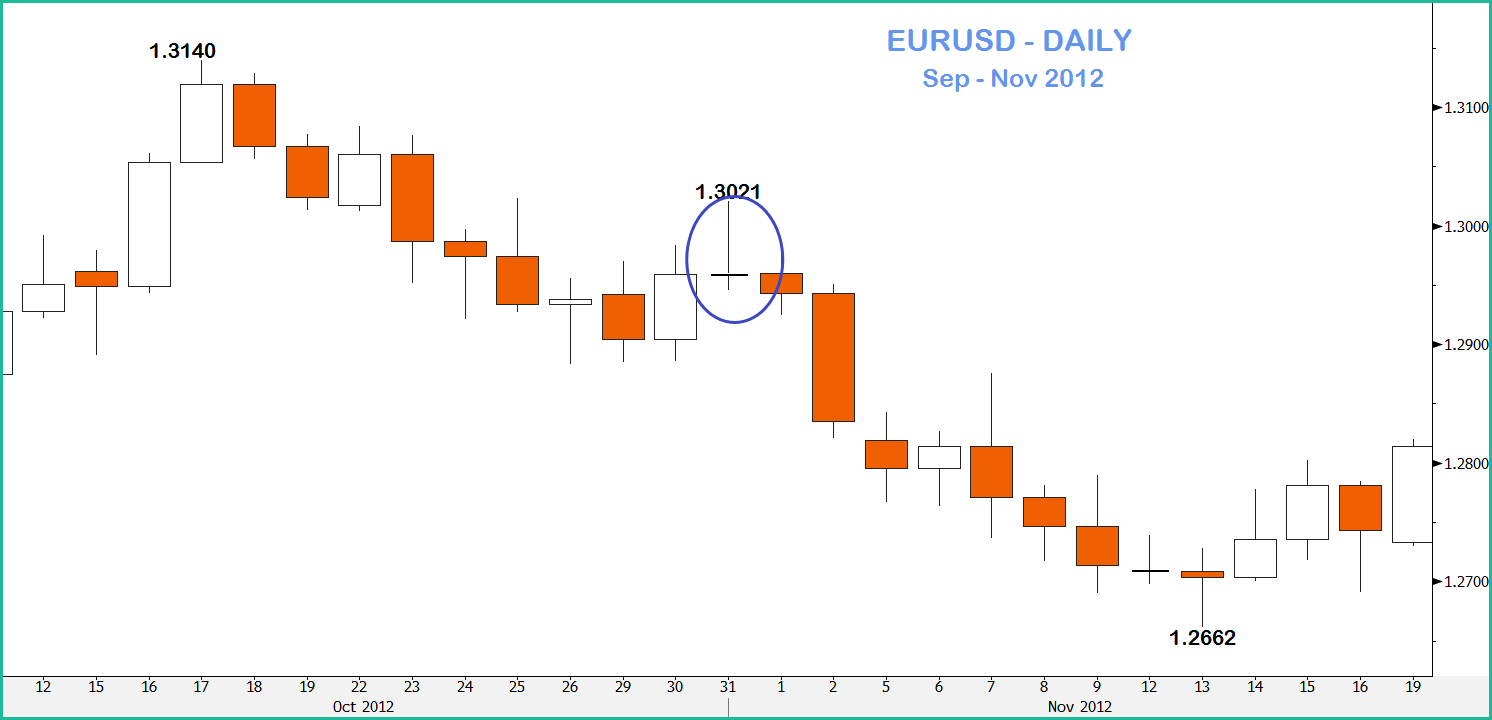
The weakness of the rally is indicated by the posting of a Gravestone Doji. Higher levels sharply rejected and an almost unchanged close. Confirmation is needed but this is given the following day by a move below the low of the Doji pattern.
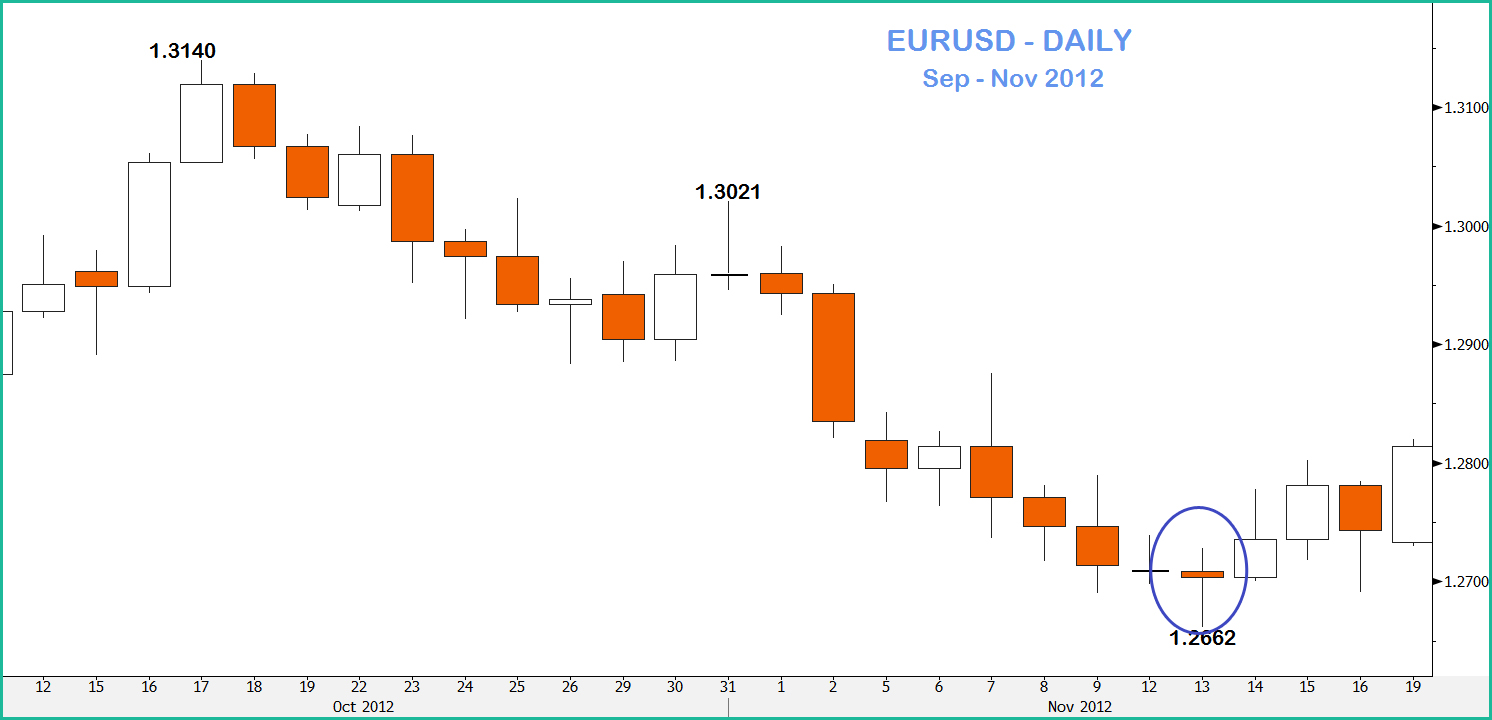
The decline then deepens further. But the base is called by, firstly a normal Doji (a warning) and then, although the lows are extended, a rejection of the downside and the creation of a Long Legged Doji pattern. Once again confirmation follows the day afterward.

