
Posts tagged 'futures'
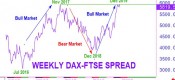
Longer-term 3 month signals have been bullish throught 2019 and our strategy to stay long and buy dips has been the correct one.However, although there is no clear bearish reversal pattern on longer dated DAX-FTSE charts, signasl in the shorter-end are highlighting warnings.Initially divergence on momentum indicators, last week the US ending long trend of higher... read more
I've pointed out on these pages before how useful both RSI and Keltner channels can be to traders across the asset classes. What I'd like to show today is how the two indicators can combine in another method of application for trading. This article is going to look at using Keltner channels around the RSI indicator rather than... read more
US$ INDEX, still long-term bearish, but looking to trade bounceWe have been bearish of the $Index throughout 2017 and in our last update on May 11th we emphasised this view by highlighting the inverse relationship between US interest rates and the US$ exchange rate.The sell-off has also come from close to a 62% recovery to the... read more
A 10 year rally in GOLD throughout the 2000’s has stalled:, but with deteriorating sentiment between 2011 and 2015 attracting buyers back to the market from close to 1087.5, a key 50% correction to the gains.Last year’s bounce has also stalled, - ahead of 1421.2, a 50% recovery to the 2012-2015 losses and a quarterly Shooting... read more

Courtesy of: Visual Capitalist CHINA AND U.S. STILL GENERATING >50% OF REAL GDP GROWTHThe Chart of the Week is a weekly Visual Capitalist feature on Fridays.According to forecasts from earlier this year by the World Bank, the global economy is expected to average a Real GDP growth rate of 2.8% between 2017-2019.But where will this growth actually... read more

3cAnalysis Performance figures for May 2017 Below is a summary of the success of our daily calls for May 2017. These are broken down into an overview of percentage of directional success. May Apr Mar 2017 FX Majors 75.2% 70.5% 79.0% 76.8% FX Crosses 60.6% 66.0% 73.8% 69.7% Equities 73.2% 69.2% 76.7% 71.3% Fixed Income 88.0% 65.5% 71.2% 78.0% Total 74.3% 68.9% 75.4% 74.4% May % Win/Lose Best Class Fixed Income 88.0% 59/8 Best performers in class. USDCHF 85.7% 12/2 GBPCHF 71.4% 10/4 ESTOXX 90.0% 9/1 BUNDS 93.3% 14/1 Underperformer EURPLN 33.3% 3/6 Performance broken down into each asset class and their components. FX Majors MAY APR 2017 EURUSD 60.0% 58.3% 75.0% CABLE 81.2% 81.8% 79.2% EURGBP 75.0% 90.9% 76.4% USDJPY 72.7% 60.0% 69.0% EURJPY 84.6% 60.0% 67.3% USDCHF 85.7% 40.0% 83.9% USDCAD 78.6% 84.6% 85.7% AUDUSD 54.6% 66.7% 75.0% FX Crosses May Apr 2017 GBPCHF 71.4% 66.7% 73.7% EURSEK 66.7% 71.4% 71.4% EURNOK 66.7% 72.7% 68.7% GBPJPY 55.6% 50.0% 68.4% AUDJPY 58.3% 40.0% 66.7% EURPLN 33.3% 85.7% 68.9% Equities May Apr 2017 DAX 81.8% 87.5% 81.1% ESTOXX 90.0% 66.7% 80.9% FTSE 71.4% 62.5% 73.8% DOW 55.6% 66.7% 61.9% S&P 60.0% 75.0% 62.8% NASDAQ 77.8% 60.0% 63.4% Fixed Income May Apr 2017 BUNDS 93.3% 66.7% 78.6% BOBLS 86.7% 72.7% 79.2% GILTS 85.7% 64.3% 76.1% T-NOTES 80.0% 55.6% 75.0% 30 yr 92.3% 66.7% 80.6% Any opinions, news, research, analysis,... read more
Our assessment of the trend for EURTRY has been bullish since July 2016 after the spot crossover of the 21 week moving average (a golden cross) confirmed a marginally earlier cross in our RSI indicator.Throughout the latter part of 2016 and the beginning of this year, those averages, and even the 13 week line, have supported... read more

3cAnalysis Performance figures for April 2017Below is a summary of the success of our daily calls for April 2017. These are broken down into an overview of percentage of directional success. ... read more

Longer-term signals have been bullish of Gold so far this year.The sell-off since the all-time high in 2011 at 1921.5 has attracted buyers back to the market in 2015 and 2016 from close to 1087.5. a key 50% pullback to the entire 2001-2011 ten year bull-run.Updates on 23rd January and 10th Feb have continued to highlight... read more

3cAnalysis Performance figures for March 2017Below is a summary of the success of our daily calls for March 2017. These are broken down into an overview of percentage of directional success. Consistency remains the key over a period of time despite sharp swings in Fixed Income and Equities during March and February as market conditions encourage volatility.... read more