
Posts tagged 'SEK'
Since December NOKSEK has been attracting significant buying. But that demand stalled, continually, in the latter part of January, at the 21 week moving average. So, despite a positive break in NOKSEK RSI, through it's own moving average, sentiment was still assessed as negative with a sequence of lower weekly highs and lows (and negative Keltner... read more
Signals for sentiment for NOKSEK have been bearish since March. Rally attempts attracted fresh selling interest at lower levels during that time. That is until the last couple of months where, despite being unable to test the key 21 week offset moving average, gradually higher lows have developed.That, coupled with a positive break of the RSI... read more
A sharp move lower at the beginning of March in NOKSEK took the market below the 21 week displaced moving average and generated an outright bearish call. This move confirmed a 'dead' cross already provided in RSI. Prices then fell by more than 4 big figures - correcting more than 62% of last year's rise - but... read more

After 3 weeks of minor gains, selling pressure in NOKSEK has been renewed this week. In fact negative momentum has accelerated - taking the cross to the most bearish levels traded since August 2016.NOKSEK RSI signals have been bearish all year but the spot only confirmed this with a negative crossover of the 21 week moving average... read more
I wrote on these pages in early March that NOKSEK was testing a key average. That average broke on a closing basis - confirming an earlier moving average break in RSI and turning our medium term bias for NOKSEK to negative on our Trend Table.Prices moved lower, then rallied but the underlying bearish tone was confirmed... read more
After posting a higher low in March and then trading through key moving averages in both spot and RSI, our bias for GBPSEK, as shown in the Trend Table, turned to bullish.Last week's solid move confirmed that new trend and demand has accelerated this week with the general improvement in investor sentiment towards sterling. Importantly though this... read more
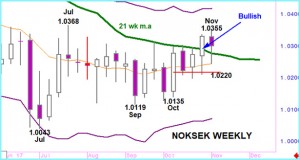
Trading this year in NOKSEK has given some mixed signals after last year's clear and aggressive upside.Profit taking from November's peak above 1.1000 led first to a negative cross in our RSI indicator during December then followed in January with a cross of it's 21 week offset moving average. But that confirming move move proved a... read more
Last week's strong decline in NOKSEK created a 5th down week from the last 6 and confirmed the negative RSI break with a move below the 21 week, offset, moving average. This in our assessment confirms a change of sentiment to bearish - ending the underlying positive tone that dominated last year. In fact last year's move... read more

Have you ever wondered which currencies receive the most trading action? The data for the following chart comes from a survey done every three years by the Bank of International Settlements (BIS).Note that trading volume adds up to 200%, because each currency trade has a pairing.Chart courtesy of: DatashownThe Chinese yuan is now the 8th most... read more
...Our Trend Table has highlighted a positive trend in NOKSEK for some months but the topside has, until now, been capped by a 38% recovery point. This level is now being seriously tested.The low from last years decline was posted this January and the RSI indicator moving above it's moving average was the first indication that... read more