GBPCAD – Positive break not maintained
14th October 2018
Updated 29th October.
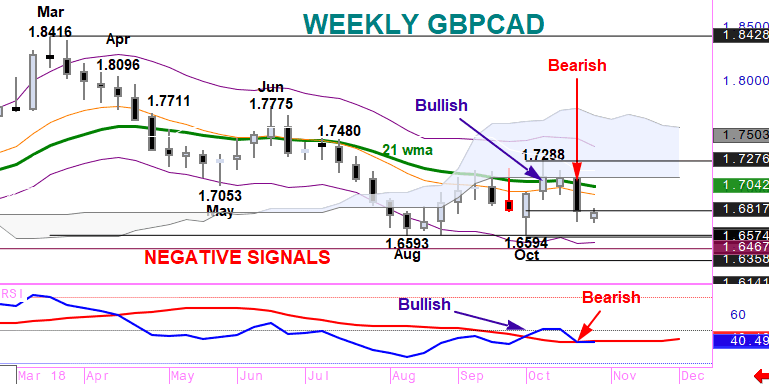
Contrary to the bullish signals generated 2 weeks ago, investor demand for GBPCAD could not be maintained. Instead selling interest was renewed with last week’s decline being the most negative GBPCAD performance since April. This is enough to reassert a Bearish bias with initial targets of 1.6574 and 1.6467.
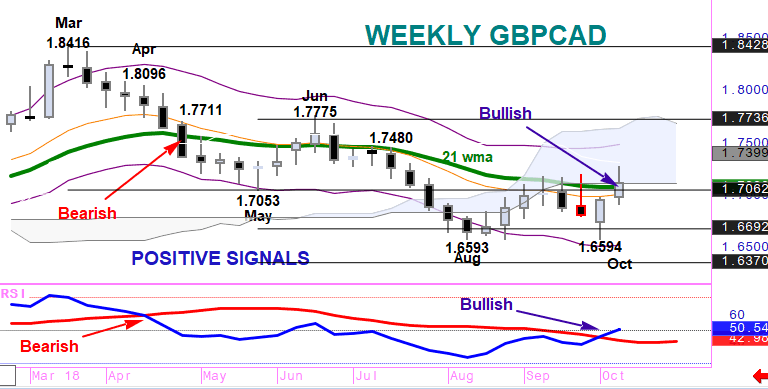
Last week saw solid gains in GBPCAD for a 2nd week in a row. This strong investor demand turned our medium term signals for sentiment to positive.
At the end of April/beginning of May, the decline from March’s high led to a negative (dead) cross in both spot GBPCAD and our RSI indicator – breaking the 21 week moving averages of both – first in RSI and, confirming, then the spot price.
GBPCAD then moved, until August’s low, more than 7 1/2 big figures lower. Spot and RSI indicators staying below their moving average throughout that period. Th rally from August’s low failed at the moving averages but the subsequent renewal of selling pressure took spot GBPCAD back to the same levels, marginally below 1.6600, at the beginning of this month.
It is the bounce from that ‘double bottom’ that has now created positive (golden) crosses in both the spot and RSI and has, therefore, turned our technical studies bullish for the coming weeks.
The immediate upside focus is on 1.7480, July’s high, then a more significant 1.7775, June’s peak, – a level that coincides, currently, with the top of the Ichimoku Cloud pattern.
Only a weekly close below the 21 week moving averages would threaten this positive GBPCAD outlook.


