S&P – Sellers Dominate
10th August 2015
Key Average Caps
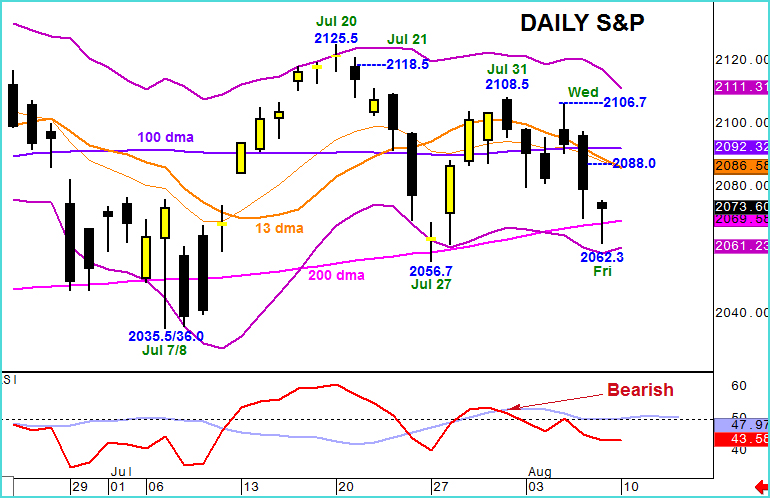
With two S&P bounces in July stalling from close to the 50 & 100 day average rates, last week’s signals switched back to bearish. These were confirmed as investors sold the market for a strong 36 Pt loss. This has extended a sequence of lower weekly highs which is negative, though the pullback is also attracting buyers from close to the 200 day average.
 Interesting though, even when opening on bullish gaps, the market is attracting selling interest with each of the last six days posting net declines.
Rallies are now being capped by what is normally a trend defining 13 day moving average and the strength indicator (RSI) has also given a negative trigger.
Of course an early, sustained, break beneath the 200 day line is looked for as confirmation and also as a likely indicator of increasingly bearish sentiment.
This week therefore we look for the losses to deepen, rallies to be contained by 2090.0 with downside potential to 2062.3, Friday’s low, 2056.7, the 2 week base and 2035.5, July’s base.
Only a move above 2108.5 is regarded as a positive signal for the S&P.
