
Posts tagged 'equities'
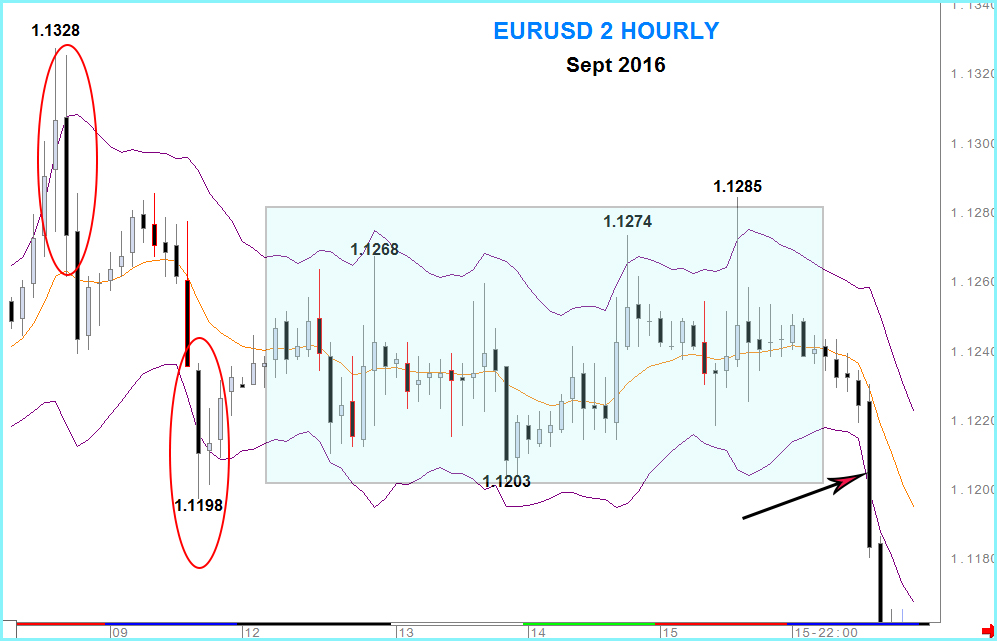
This article is about Keltner channels and how, using them as trend indicators, they can aid trading on almost any time scale.Firstly we’ll cover the theory then practice of how I use them in analysis across the asset classes with some recent examples to see how they work.Keltner channels can be invaluable as a tool for... read more

Your Own Worst Enemy. - Why it is so hard to develop a real ‘Behavioural Edge’ in Trading.a guest article by Steven GoldsteinThe Dunning-Kruger effect is a behavioural bias which refers to people’s belief that they are more capable than they really are. This is a cruel trick played on traders by themselves which keeps most... read more

3cAnalysis Performance figures for May 2017 Below is a summary of the success of our daily calls for May 2017. These are broken down into an overview of percentage of directional success. May Apr Mar 2017 FX Majors 75.2% 70.5% 79.0% 76.8% FX Crosses 60.6% 66.0% 73.8% 69.7% Equities 73.2% 69.2% 76.7% 71.3% Fixed Income 88.0% 65.5% 71.2% 78.0% Total 74.3% 68.9% 75.4% 74.4% May % Win/Lose Best Class Fixed Income 88.0% 59/8 Best performers in class. USDCHF 85.7% 12/2 GBPCHF 71.4% 10/4 ESTOXX 90.0% 9/1 BUNDS 93.3% 14/1 Underperformer EURPLN 33.3% 3/6 Performance broken down into each asset class and their components. FX Majors MAY APR 2017 EURUSD 60.0% 58.3% 75.0% CABLE 81.2% 81.8% 79.2% EURGBP 75.0% 90.9% 76.4% USDJPY 72.7% 60.0% 69.0% EURJPY 84.6% 60.0% 67.3% USDCHF 85.7% 40.0% 83.9% USDCAD 78.6% 84.6% 85.7% AUDUSD 54.6% 66.7% 75.0% FX Crosses May Apr 2017 GBPCHF 71.4% 66.7% 73.7% EURSEK 66.7% 71.4% 71.4% EURNOK 66.7% 72.7% 68.7% GBPJPY 55.6% 50.0% 68.4% AUDJPY 58.3% 40.0% 66.7% EURPLN 33.3% 85.7% 68.9% Equities May Apr 2017 DAX 81.8% 87.5% 81.1% ESTOXX 90.0% 66.7% 80.9% FTSE 71.4% 62.5% 73.8% DOW 55.6% 66.7% 61.9% S&P 60.0% 75.0% 62.8% NASDAQ 77.8% 60.0% 63.4% Fixed Income May Apr 2017 BUNDS 93.3% 66.7% 78.6% BOBLS 86.7% 72.7% 79.2% GILTS 85.7% 64.3% 76.1% T-NOTES 80.0% 55.6% 75.0% 30 yr 92.3% 66.7% 80.6% Any opinions, news, research, analysis,... read more

3cAnalysis Performance figures for April 2017Below is a summary of the success of our daily calls for April 2017. These are broken down into an overview of percentage of directional success. ... read more

3cAnalysis Performance figures for March 2017Below is a summary of the success of our daily calls for March 2017. These are broken down into an overview of percentage of directional success. Consistency remains the key over a period of time despite sharp swings in Fixed Income and Equities during March and February as market conditions encourage volatility.... read more

Are we headed for a bond market bloodbath? - a guest articleby Simon Jack BBC Business editorThe greatest bull market in history is over. Last week's rise in US interest rates confirms the reversal of a 30-year trend, and that spells big trouble according to some Cassandras.There have been bumps in the road along the way but the market... read more

3cAnalysis Performance figures for February 2017Below is a summary of the success of our daily calls for February 2017. These are broken down into an overview of percentage of directional success. FebJan2017FX Majors77.1%80.6%78.9%FX Crosses72.5%75.0%73.6%Equities61.8%75.6%68.0%Fixed Income85.3%79.2%82.1%Total75.0%78.2%76.6% February %Win/LoseBest ClassFixed Income85.3%58/10Best performers in class.EURUSD100%9/0GBPCHF92.3%12/1ESTOXX88.9%8/1t-notes92.8%13/1UnderperformerS&P28.6%2/5 Performance broken down into each asset class and their components.FX MajorsFebJan2017EURUSD100%86.7%91.7%CABLE80.0%66.7%73.3%EURGBP60.0%78.6%69.0%USDJPY72.7%75.0%73.9%EURJPY58.3%66.7%61.9%USDCHF92.3%92.9%92.6%USDCAD86.6%86.7%86.7%AUDUSD66.6%88.9%80.0% FX CrossesFebJan2017GBPCHF92.3%63.6%79.2%EURSEK66.6%77.8%71.4%EURNOK50.0%69.2%60.0%GBPJPY73.3%88.9%79.2%AUDJPY85.7%72.7%77.8%EURPLN70.0%85.7%76.5% EquitiesFebJan2017DAX69.2%100%80.6%ESTOXX88.9%88.9%88.9%FTSE87.5%42.9%66.7%DOW40.0%100%62.5%S&P28.6%75.0%53.3%NASDAQ50.0%50.0%50.0% Fixed IncomeFebJan2017BUNDS92.3%64.3%77.8%BOBLS73.3%78.6%75.8%GILTS90.9%85.7%88.0%T-NOTES92.8%85.7%89.3%30 yr80.0%81.2%80.6% Any opinions, news, research, analysis,... read more
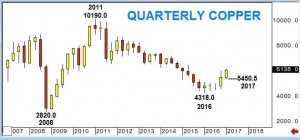
Copper is the only market we cover in the trend table and following a long period of bearish sentiment our signals switched to bullish in the weeks leading up to, and confirmed following the US Election in November.The other base metals have signalled a similar switch, buyers returning to the market in early 2016, well before... read more

3cAnalysis Performance figures for January 2017Below is a summary of the success of our daily calls for January 2017. These are broken down into an overview of percentage of directional success.Trading conditions were thinner than normal for the beginning of the year with Brexit and Trump repercussions contributing to volatility. Nonetheless our performance remains consistent across the... read more

3cAnalysis Performance figures for November/December 2016Below is a summary of the success of our daily calls throughout November and, a shortened, December 2016. These are broken down into an overview of percentage of directional success.Trading in November was dominated by the surprise US election result which caused more volatility than the Brexit shock. As usual the... read more