CADJPY – Sentiment turns Negative
20th June 2016
….Last week’s strong decline in CADJPY , and bearish RSI crossover, has confirmed a renewed negative tone for sentiment.
The key 21 week moving average was broken on the downside in July 2015. This negative move confirmed the previous week’s ‘dead’ cross in RSI indicators. Price action has been capped by the 21 week moving average since that point – almost 1 year – allowing for a 2 week spike above this April. Rallies have been broadly capped by that average, or even the more aggressive 13 week line, during that time.

RSI has had a more volatile ride, especially in the early part of this year where a positive trigger was given that was not supported by the spot price – divergence that emphasised the weakness of the bounce despite the fact that the broad CADJPY consolidation lasted for 3 months.
Last week’s fall took CADJPY RSI back below it’s moving average.
The same signals have/are also seen in another important technical analysis indicator – DMI Difference. DMI itself – marked by the histogram on our 2nd chart – has been negative since July 2015 but the more sensitive, and tradable, Difference indicator mirrored the RSI divergence in the early part of this year. Here again signals have turned downward.
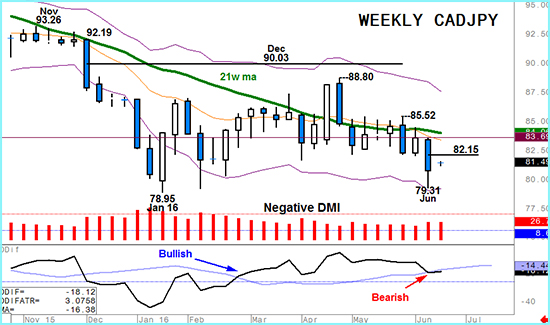
So, CADJPY sentiment going forward is assessed a bearish. The profit taking that ended last week may well result in better levels to short – 82.15, last week’s Marabuzo line should find sellers – with the downside expected to target the 78.95/79.31 area. A breach there would then expose sentiment to 77.90 or even 76.23.
Currently the risk is May’s 85.52 top or, more conservatively, a weekly close above the 21 week line, currently 84.06.
