EURTRY – Testing Key Averages
5th April 2017
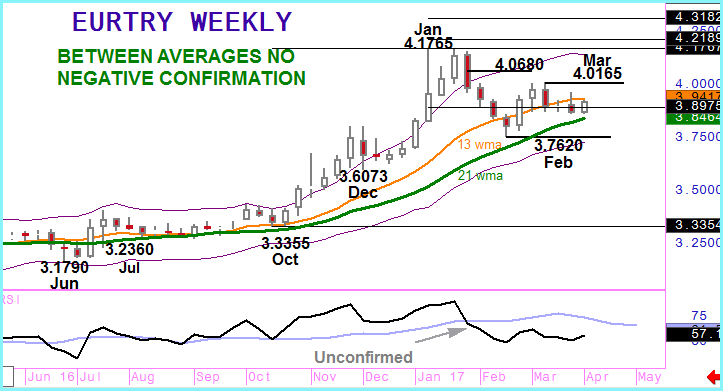
The setback from January’s all-time high in EURTRY has reached key levels, and the reaction to those levels is likely to confirm or change the medium term bias. A bullish trend was clear throughout the latter part of 2016 with the strength of the uptrend emphasised by a hugging of the upper band of the weekly Keltner channel for the majority of that time.
EURTRY reached it’s peak with a spike higher at the beginning of January with a subsequent attempt above 4.1700 failing at marginally lower levels. The first pullback created a negative crossover in EURTRY RSI but this was not confirmed in spot with the profit taking finding buyers close to the 13 week moving average. A renewal of demand was limited though and unable to sustain prices above 4.000 which has led, over the last 3 weeks, to sustained levels below the 13 week line.
But the key is the longer dated 21 week average and this has yet to be tested. In fact this week has attracted buying pressure comfortable above that point. So EURTRY is now trading between the two averages and although we are maintaining a long term positive bias for this cross currently we are watching the averages closely.
A move back above the 13 week, currently 3.9415, confirms that the bulls remain in charge. On the other hand a close below the 21 week (3.8460) would confirm the negative RSI readings and change sentiment to bearish. We will update our Trend Table and advise on this Commentary page when/if the situation changes with updates on potential targets on the downside if the EURTRY bias changes.