GBPCAD – warning signs for bears
15th February 2017
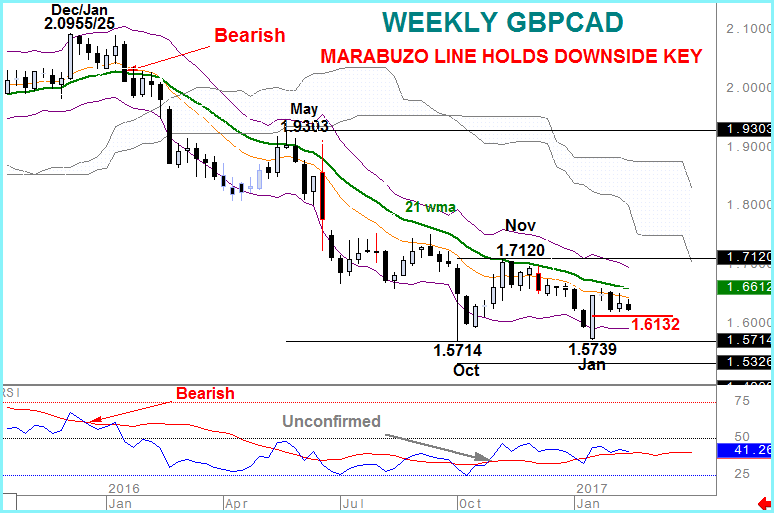
A negative trend has dominated GBPCAD for more than a year. A bearish move below the 21 week moving average in January 2016 confirmed an earlier breach of the RSI moving average and that tone has been threatened occasionally, by moves back to the moving average, but unbroken since.
In fact, GBPCAD fell by 22% to October’s low.
But although the bias is unaltered there are warning signs.
- RSI moved above it’s moving average in November.
- January’s GBPCAD low was marginally higher than last year’s.
- This month’s renewed selling has yet to gain momentum or break through a Marabuzo line created by the aggressive bounce from this year’s low.
It is that Marabuzo line, 1.6132, that holds the downside key. A break below or rather a weekly close below is needed to renew significant selling pressure (with the focus then on 1.5326). Failure to move through that point will, inevitably, lead to a test of the declining 21 week average (currently 1.6612) with a close above confirming the RSI signal and a change in medium term GBPCAD investor sentiment.