NZDUSD – Demand continues to dominate
20th April 2016
This year’s gradual gains have reached a key point but 3cAnalysis signals show no sign of anything other than temporary and limited setbacks.
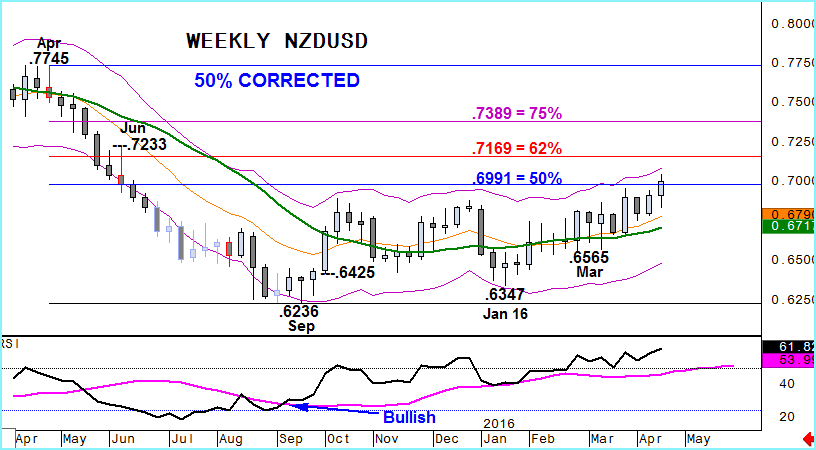
The latter part of 2014, and the bulk of last year, was dominated by a declining NZDUSD. This was a move that was marked by a hugging of the lower end of a falling weekly Keltner channel with profit taking rallies capped by key 13/21 week moving averages.
The first signs of that ending were provided by a positive cross in RSI above it’s moving average. Although that was followed by almost 6 months of sideways, trendless, trading the last 2 months have seen RSI accelerate as gradual demand for NZDUSD has developed. – see chart below.
This week’s gains have seen the currency pair recover half of the decline from April’s peak and move near the top of a rising weekly Keltner channel.
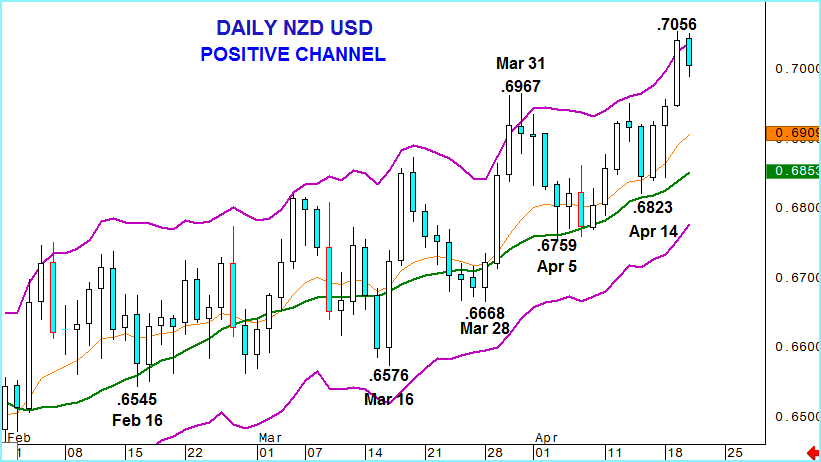
If we drill down to a daily chart the current positive trend is further highlighted by a steady series of higher lows and highs, a bullish Keltner channel and the fact that profit taking setbacks are being contained by a 13/21 day moving average area.
Where do we go from here?
Of course we need to see a clear/sustained break of the 50% point to confirm but our studies and focus remains on the topside with a broader 62% recovery at .7169 then .7233 the initial objectives.
The risk is a weekly close below the 13 week average, currently at .6790, although only below the 21 week line and a negative cross in NZDUSD RSI will give a completely negative trend.


