Where next for CADJPY?
5th August 2015
This year’s price action has been volatile but has also emphasised the importance of Fibonacci numbers in analysing from a technical perspective.
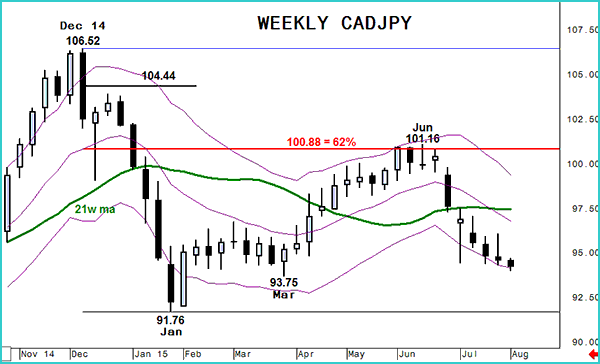
The fall from last December’s peak reached almost 15 big figures before February began with a Bullish Engulfing pattern for CADJPY on weekly candle charts. That pattern often signals a complete change in sentiment direction after a pronounced move. The resulting gains were more gradual than the preceding decline and, over 4 months, regained virtually exactly 61.8% of the fall.
The resumption of selling pressure came after 4 weeks of consolidation below that keyretracement point and the subsequent selling pressure has been almost as aggressive as the original deterioration – almost 7 big figures.
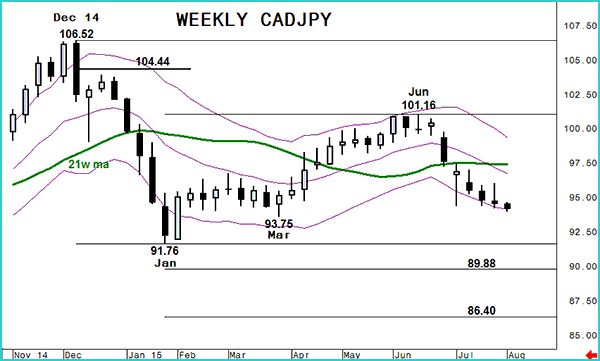
This fresh negative trend is highlighted by a ‘hugging’ of the lower end of a falling weekly Keltner channel and although net losses over the last 4 weeks have been modest 3cAnalysis signals in CADJPY continue to point lower.
A move through March’s 93.75 low for CADJPY would be further confirmation as it breaks the last significant higher low. The market is then free to focus on 91.76, this year’s bottom, then Fibonacci projected points at 89.88 then 86.40.


