Posts tagged 'Shooting Star'
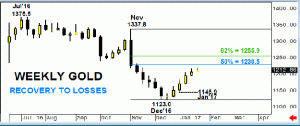
GOLD - testing 1st bullish targetA quarterly Shooting Star at last year’s high which had come from just below Ichimoku Cloud Cover and then the break of the Q3 low switched longer-term signals for GOLD to bearish in the last half of 2016. However, the subsequent sell-off has stalled from close to a 50% correction to the... read more
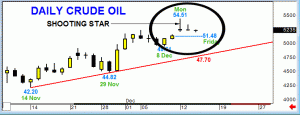
CRUDE OIL Update – Daily Shooting Star at 2nd test of neckline.In August our longer-term signals turned bullish in Oil when prices were trading just above $40. The initial target was at $51.34 and a potential target from a reverse Head & Shoulders formation is at $75.00. While this did raise some eyebrows our 1st target... read more
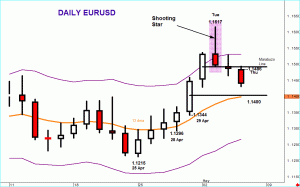
...A bearish Shooting Star pattern dominates EURUSDTuesday saw the gains from last week's low extend aggressively and prices reached the most positive levels for 9 months.But these extremes, and overbought extremes, were sharply rejected despite the prior hugging of the top of the Keltner channel.That upside rejection created a Bearish Shooting Star pattern on daily EURUSD... read more
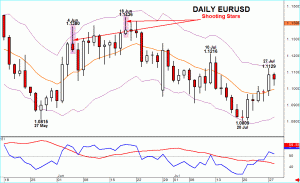
The Shooting Star created at the beginning of May 2016 has been proved although the scope of the downside remains, at the time of writing, modest. see EURUSD - Shooting Star dominatesBut are Shooting Stars a good indication of a change in formation? Well, the bad news is that they are a rare pattern on FX charts.... read more
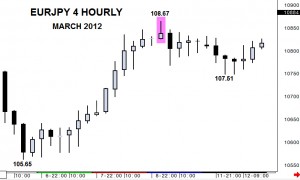
There aren’t many analysts out there that don’t now use candlestick charts as opposed to bar charts. The reason is quite obvious once you’ve seen a candle chart and it is that they offer everything a bar chart does but with the added value of graphically showing the key open and close. This immediately helps to... read more


