Bearish Candle Signals
6th July 2015
There aren’t many analysts out there that don’t now use candlestick charts as opposed to bar charts. The reason is quite obvious once you’ve seen a candle chart and it is that they offer everything a bar chart does but with the added value of graphically showing the key open and close. This immediately helps to understand the underlying tone of the market and also, by means of the formations we will cover, gives clues as to the market’s direction.
Bearish Candle Signals
Engulfing, Piercing/Dark Cloud , Hanging Man , Falling Three ,Inverted Hammer/Shooting Star
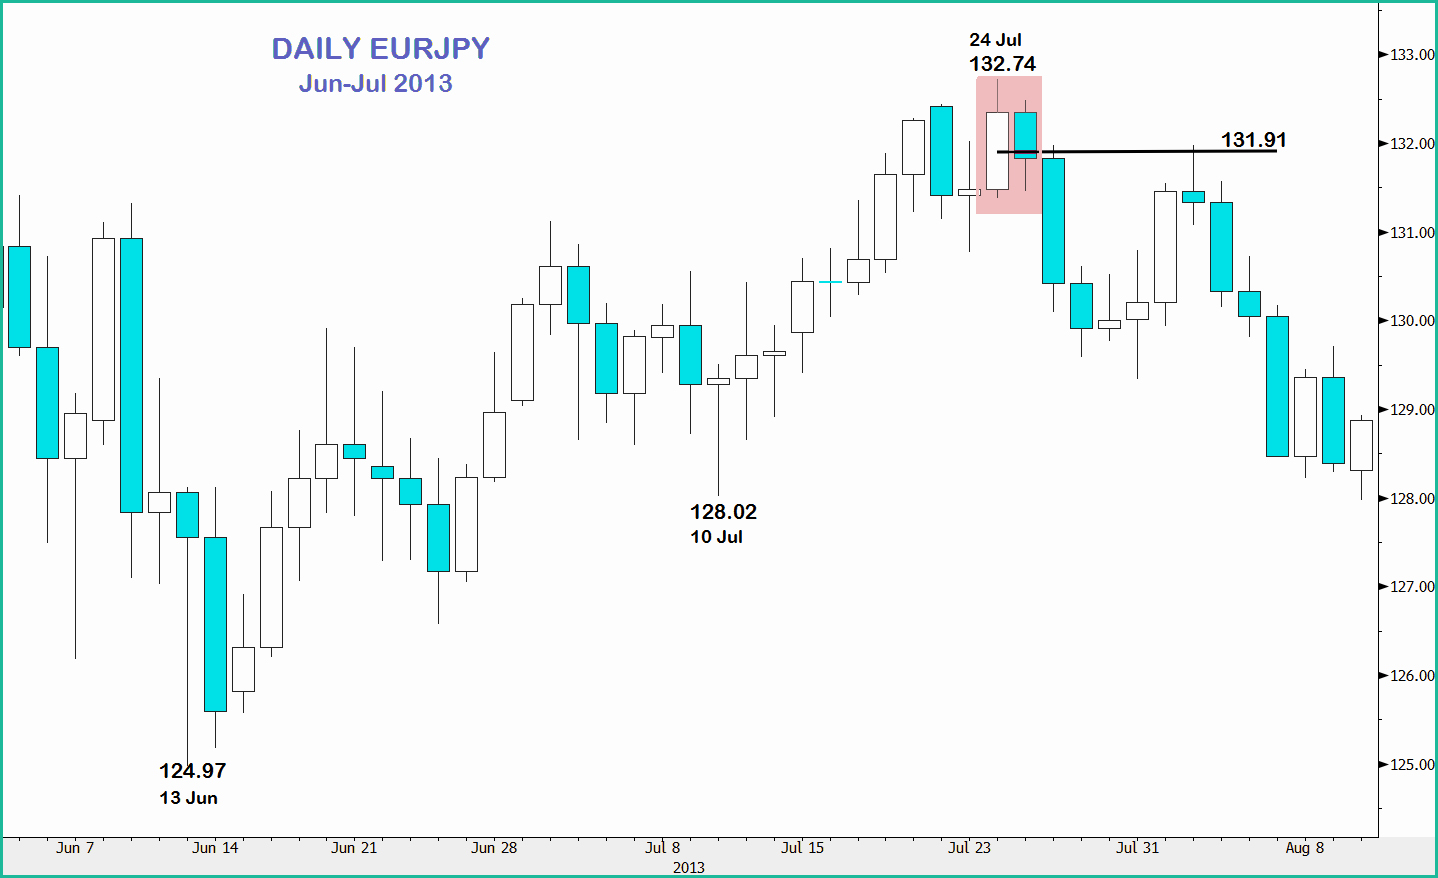
Bearish Evening Star
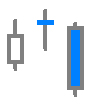
This is the mirror image of the Bullish Morning Star pattern.. As you can see the classic setup for a Bearish Evening Star is, for the first candle, a strong move lower that maintains the underlying bullish tone of the market.
Prices then consolidate and the resulting candle shows little net movement.
Often this hesitation is followed by a renewal of buying interest pressure and the overall tone of the market is intact, but when the 3rd candle shows powerful selling–and losses must reverse more than half of the net gains– then the Evening Star pattern is confirmed.
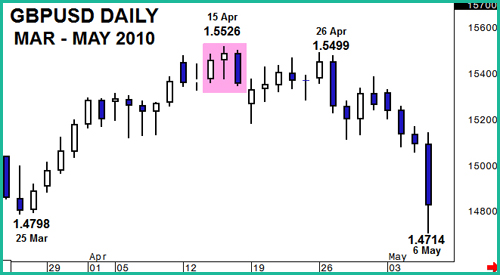
The example above is of a Bearish Evening Star on GBPUSD charts from 2010.
It should be stressed that these patterns are rare. A number of chart packages will highlight their formation more often but it is important to realise that this is a topping formation and so, while price action can sometimes result in 3 similar candlesticks if the market is still trending then it is not relevant.
How to tell if the market is trending or ripe for a correction is a subject for elsewhere but broadly speaking other studies such as Stochastics or RSI will provide that information. All technical signals must be taken in context and that is true for all candle patterns.
In this example has risen from 1.4800 to above 1.5500 in just 15 days. Without a doubt, the market would be overstretched but does that lead to consolidation or correction.
The clue is given by the by the 3 candle pattern that sees initial gains continuing the trend, followed by a 2nd day where small gains are posted but they are not extensive and the bulk of the trading day saw rejections of both lows and highs. That type of candle reflects uncertainty and this was resolved on the 3rd day of this formation with a strong decline (the most aggressive for 17 days).
It was still far from clear that this would prove to mark a top and initially, after rejecting a gap lower the next trading day, GBPUSD rallied back close to the highs. However failure occurred again, at slightly lower levels, and with a Bearish Engulfing pattern. Prices then decline sharply back to where they came from, near 1.4700.

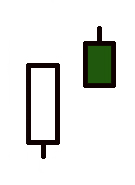
Engulfing patterns (Bullish & Bearish) consist of 2 candles and also signals a complete change of direction. The image shown here is of the formation of a Bearish Engulfing pattern with the 1st candle showing fairly sizeable gains but the 2nd entirely overturning that upside. Obviously the larger the price action shown by the first candle, the more significant the reversal can be – there should however be an awareness that exceptionally large candles, first and second, probably denotes a non-technical event and therefore some awareness of the context may be needed to assess the impact.
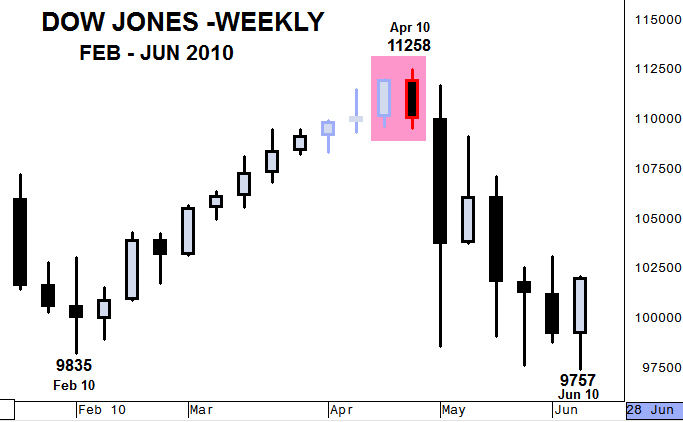
On this weekly DJI chart you can see the February low at 9835 signalled by a Bullish Engulfing pattern which led to gains of more than 1400 points over the next 11 weeks.
This upside reached overbought extremes – marked by the lighter candles above – with the peak marked by a Bearish Engulfing pattern. That particular negative formation was also a Bearish Outside Day (higher high and lower low) so the bearish signal was multiplied.
1500 points were then lost over the next 6 weeks. An excellent signal when produced at extremes as you can see.
Bearish Piercing/Dark Cloud Cover
This pattern is the negative equivalent of the Bullish Piercing pattern. To achieve that the net decline has to reverse more than half of the preceding period. If the fall is not deep enough to confirm the creation of the Piercing pattern it could form the marginally less significant Dark Cloud.
Here is an example of a formation that is borderline between a Dark Cloud and a Bearish Piercing. The key is the preceding day’s real body of the candle and whether the subsequent decline closes more than half way through that real body. A Marabuzo line.
In this particular case the close was very marginally below the Marabuzo line so it a Piercing line. In practice there is very little difference in the impact but the key is looking for confirmation in the period(s) after. (A move through the low of the Dark Cloud/Piercing).
In this case that confirmation was aggressive.

This is an unusual pattern as it shows a strong downside rejection but is not a positive signal. Following a clear up trend the open of this 1 candle pattern should lead to selling pressure but while the lows are sharply rejected, it is the attempt by the market to sell that is the key. Of course confirmation is even more important for this particular formation. It is vital that the next period closes below the real body of the ‘Hanging Man’ to confirm.
Conversely, a move through the high of this candle would negate the ‘Hanging Man’ scenario and continue the underlying bullish tone.
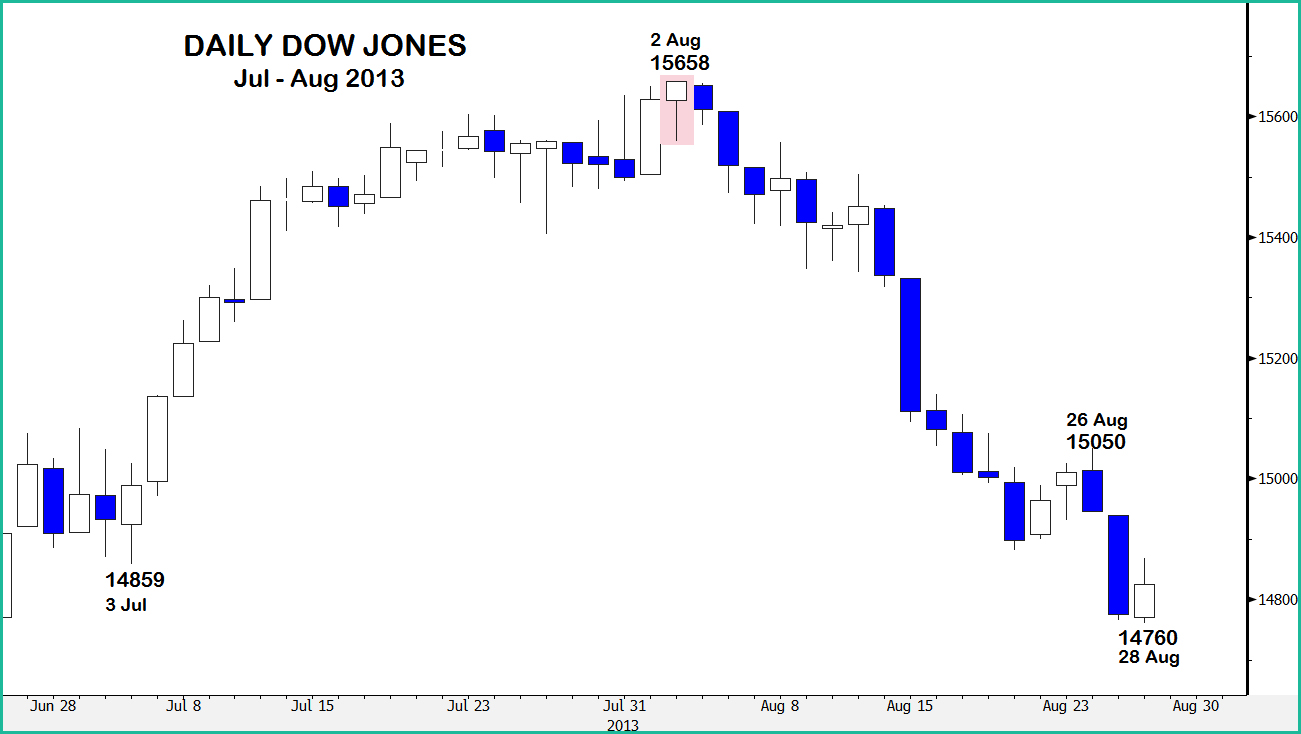
It is important to note for a Hanging Man pattern that the actual real body is almost irrelevant. Whether a small net gain or loss is posted (though perhaps a loss has more weight) as the key element is that the market tries lower from levels that are overbought. As important is the confirmation. The following period must not trade higher and the low of the Hanging Man should be broken as soon as possible as confirmation.
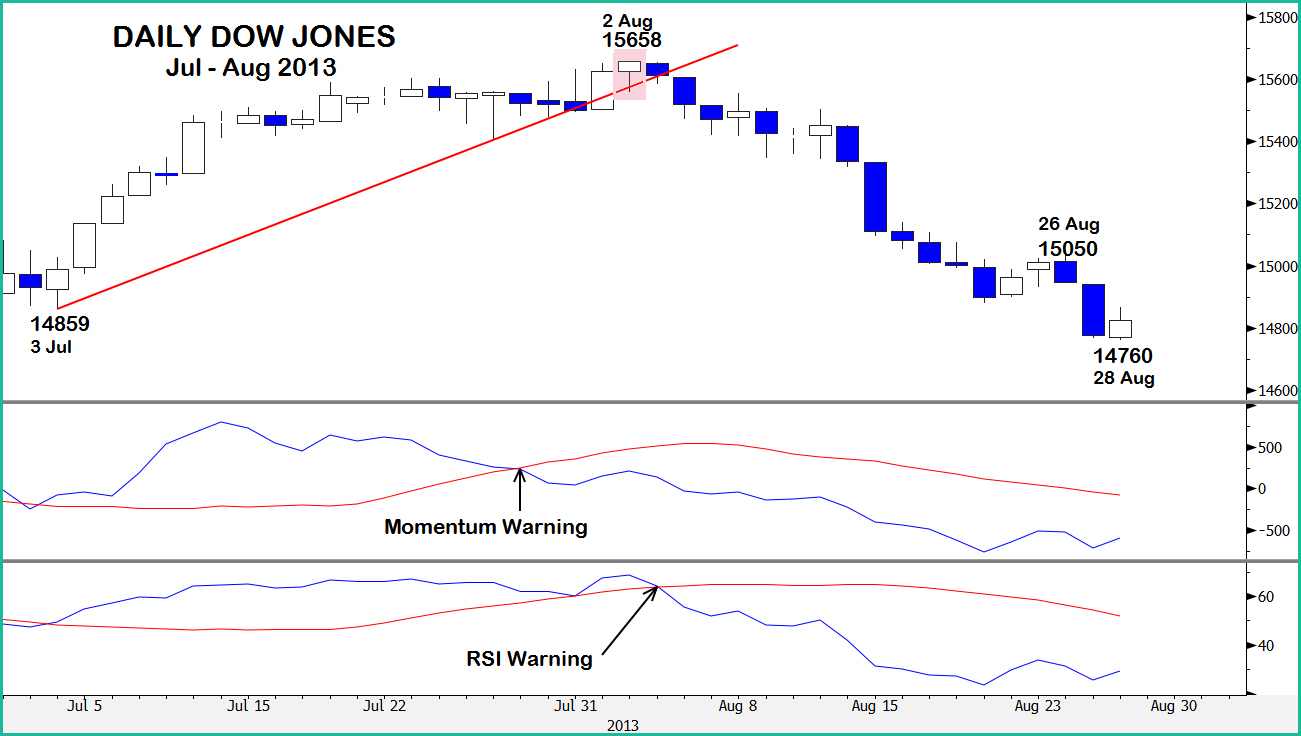
We’ve mentioned before and we’ll continue to mention Perspective as crucial to assessing all manner of technical signals and studies. When looking at this Hanging Man we need to be sure that the market is ripe for a correction and if we look at the same chart with an added trendline that needs to be broken to confirm, Momentum that gives an advance warning and RSI that also gives quick confirmation you can see that the necessary background features are in place for the formation to work.

The Inverted Hammer pattern shows an aggressive rejection of the period’s high and it this upside failure, rather than whether the candle body shows small net gains or losses, that is important. As such it is a mirror image of the Bullish Hammer.
A more extreme, and less common, variation of the Inverted Hammer is a Shooting Star. This is rarer as to form a perfect example the period that forms the upside failure has to open with a bullish gap higher and then the period following this candle opens with a gap lower. Due to the 24 hour FX markets the Shooting Star is almost never seen, but futures markets do produce such patterns.
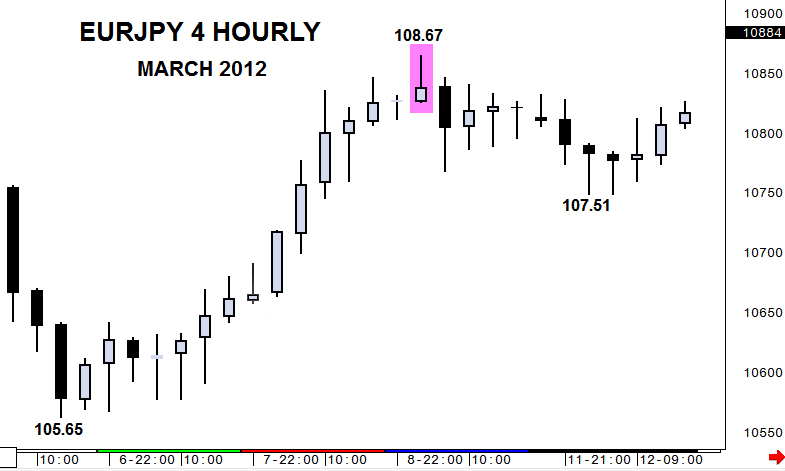
Here the Bearish Inverted Hammer was drawn at the peak of a strong improvement. Gains of more than 3 big figures would, without a doubt, mean that the market was over-stretched. This led to the Bearish Inverted Hammer pattern which resulted in a reasonable profit taking setback.
Note that this is not a Shooting Star due to the lack of gaps but below is an example of the gap that creates the Shooting Star.
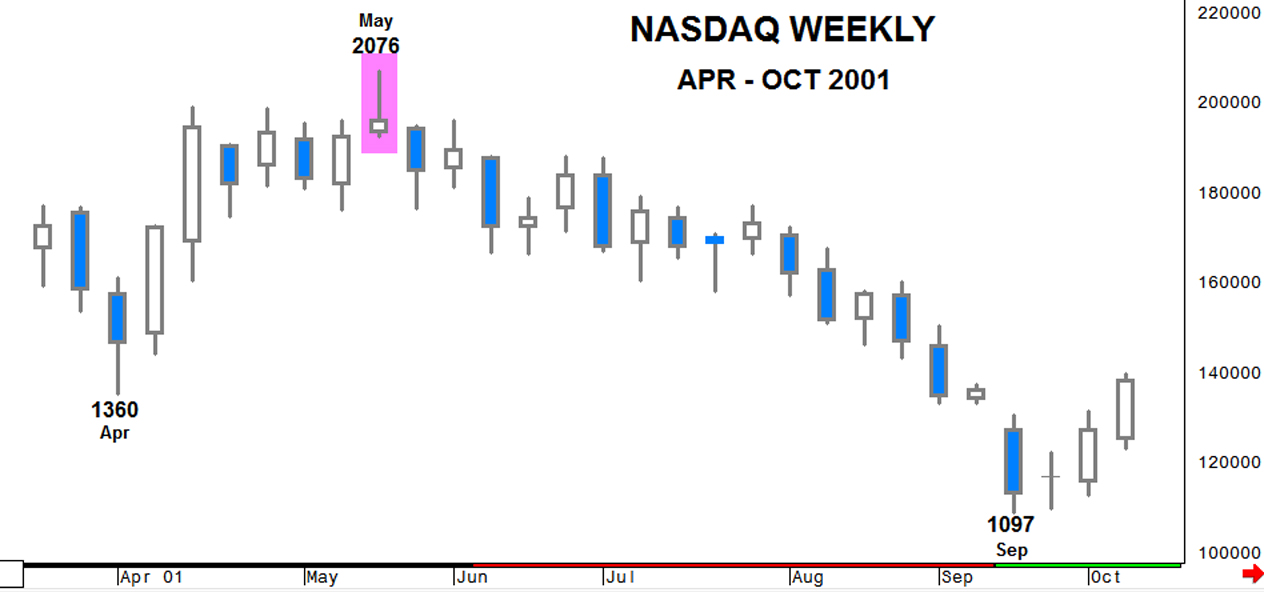
The chart is of the Nasdaq weekly during 2001. The Shooting Star comes at the end of a relatively short rise of only 8 weeks and 716 points – in fact this chart represents a portion of a much longer downtrend. Despite the limited nature of the improvement the upside rejection was a sharp one and created significant top.
Subsequent losses totalled 979 points over 18 weeks. You can clearly see that while this extreme version of an Inverted Hammer is rare, it is an excellent signal.
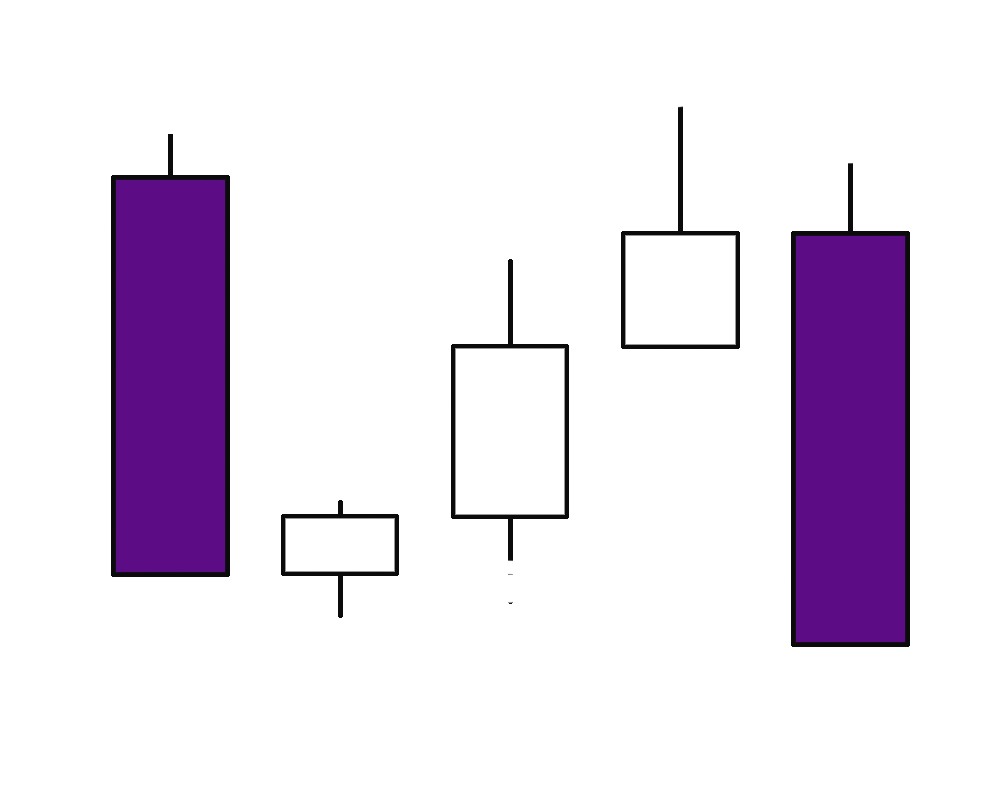
This pattern is the mirror image of the bullish Rising Three. In one sense it is bearish and the other continuation as for it to be valid it needs to be created within a negative trend. This trend is interrupted, after a sizeable down candle, by a profit taking rally that, ideally should be 3 up periods but weak enough to only reverse the preceding down candle or perhaps not even that.
The formation is completed by a renewal of selling pressure that results in a strong fall – very often the 5th candle is a similar size to the 1st.
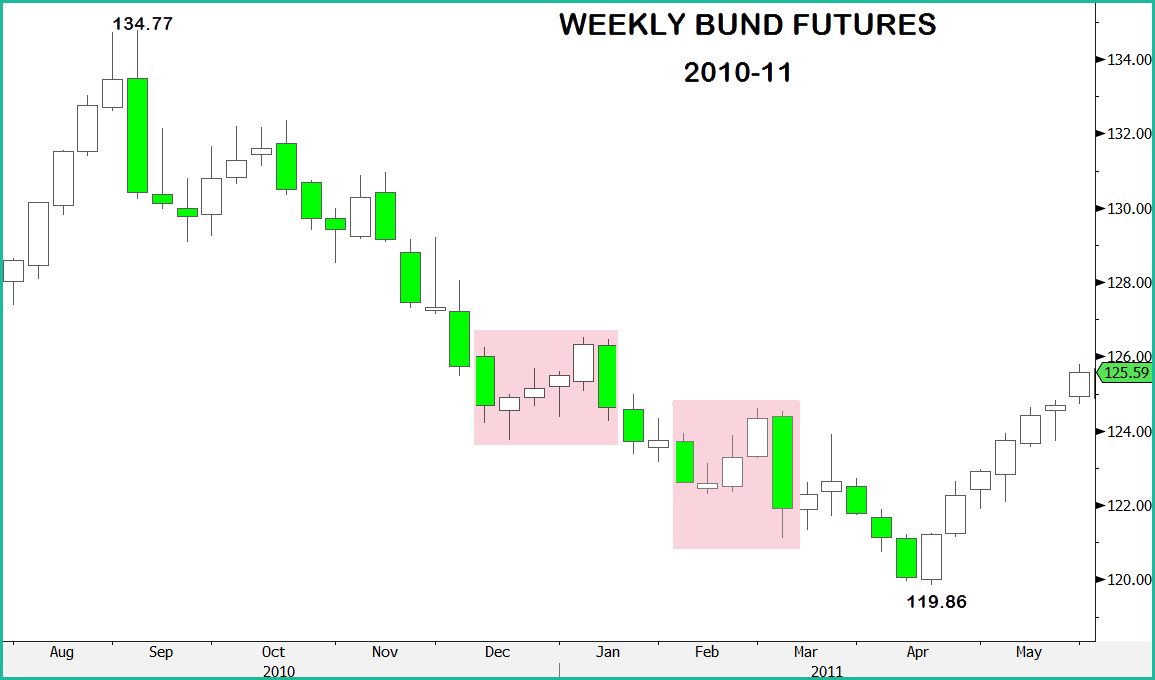
This pattern is a relatively rare one and certainly in textbook form. These 2 examples from the weekly Bund futures show as much each show a temporary reaction inside a clear bear trend but the first has 4 up weeks, not 3, and the second has the corrective move somewhat outside the first week’s parameters. Nonetheless these are valid formations that confirmed the continuation of the underlying trend.
