Shooting Stars – rare but useful
5th January 2016
The Shooting Star created at the beginning of May 2016 has been proved although the scope of the downside remains, at the time of writing, modest. see EURUSD – Shooting Star dominates
But are Shooting Stars a good indication of a change in formation?
Well, the bad news is that they are a rare pattern on FX charts. This is because in a textbook situation the Shooting Star candle should gap higher from the previous period’s action and be followed by a negative, confirming, gap on the subsequent candle. As the FX market is pretty such 24 hour those sort of gaps are infrequent.
So some flexibility needs to be employed but even in those circumstances we need to go back to the middle of 2015 for the last examples on Shooting Stars in EURUSD.
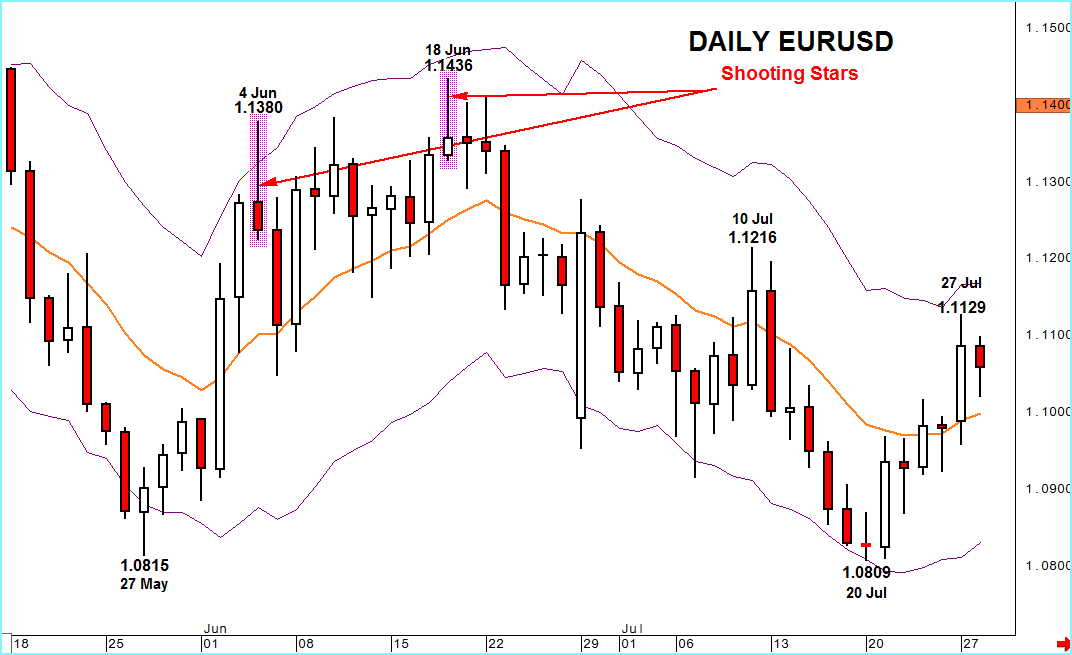 As you can see from the chart the good news is that these patterns has success – although to differing degrees. Both came after significant upside (though the later one was obviously after further gains) and both came near the top of the Keltner channel and rejected the upper band of that channel.
On the 4th June the upside rejection led to a sharp move the following day back to the mid point of the channel (the 13 day moving average) and that level held (on a closing basis) which led to a renewal of demand. 2 weeks later another upside rejection, confirmed the next day with a lower low, led to a more aggressive decline that broke the key average and took EURUSD to the lower band of the Keltner channel.
This decline extended, hugging the lower end of the channel for almost 1 month and reached more than 6 big figures, high to low.
The different impact of these two similar (at the time) patterns is important and that’s why it is essential to place price action in context.
One of my favourite ways of adding that context is by using a moving average on RSI and on the chart below you can see a significant difference on that indicator for the Shooting Stars – RSI was above its moving average for the first Star, and stayed that way. This indicates that the trend was still bullish.
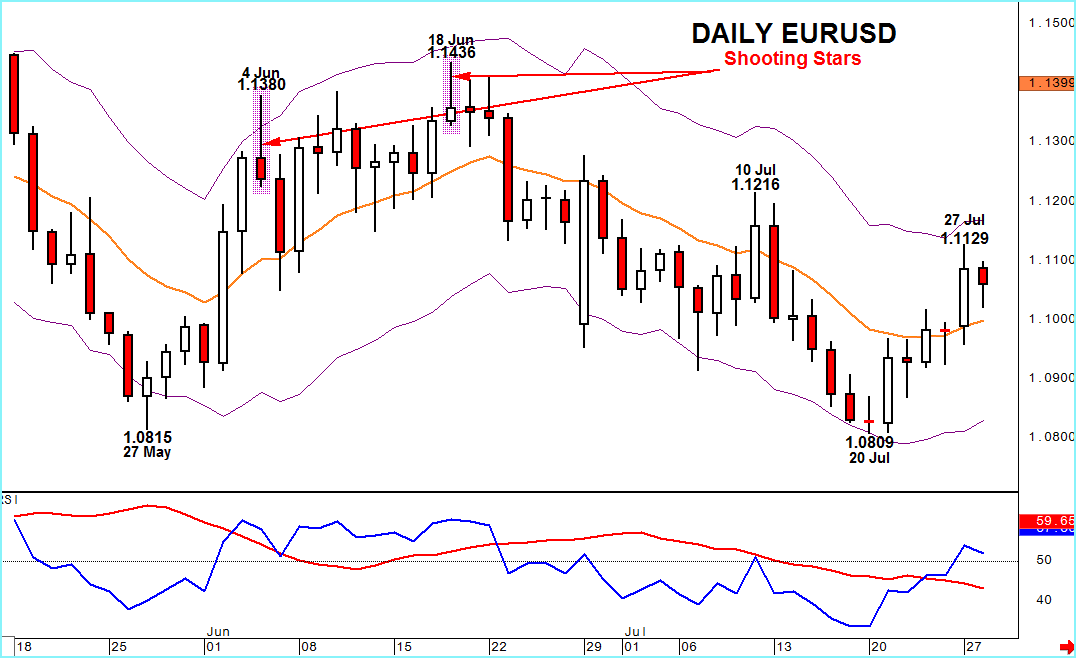
But although the RSI was still positive at the time of the second Star, the break through of the middle of the channel a few days later was the confirmation and a trigger for downside acceleration.
