EURHUF – Building base for further Gains
25th June 2015
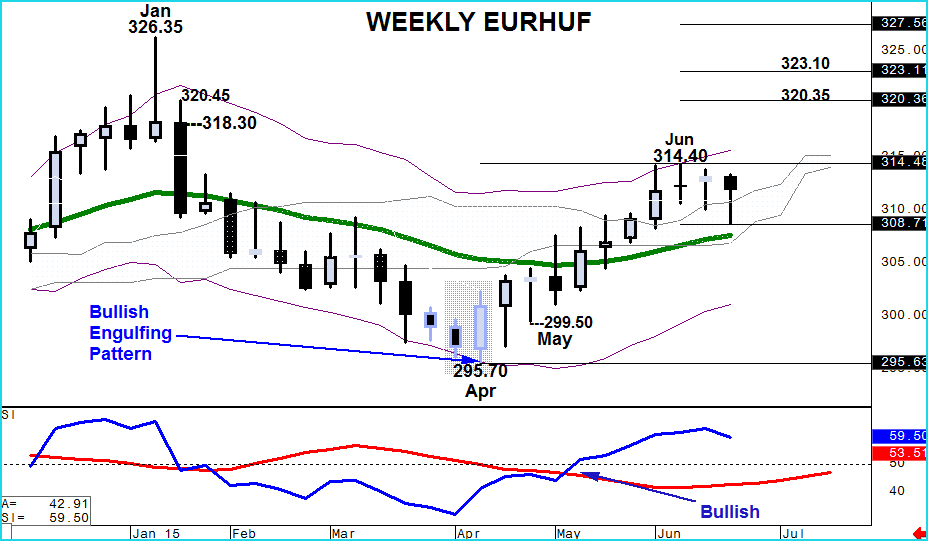
The bounce from this year’s 295.70 low in EURHUF was marked on weekly candle charts by a Bullish Engulfing pattern. The market has not threatened the subsequent up move significantly since with a sequence of 8 higher lows only ending over the last 2 weeks.
The positive EURHUF trend that was begun with the Engulfing pattern was confirmed firstly with a bullish crossover of the RSI over a RSI moving average, then by a close above the 21 week moving average. These factors remain in place.
The stalling/consolidation that has taken place over the last 2 weeks has corrected almost 38% of the 9 week improvement but setbacks, such as seen this week, continue to be limited – emphasising the underlying tone.
In addition a rising Keltner channel and support offered within the weekly Ichimoku Cloud are positive indicators and so we look for demand to build again with potential to projected levels at 320.35 and 323.10 in the coming weeks.


