Commentary
3c Analysis Commentary Page - Adding Value
On these pages we will expand upon some of our forecasts, talk about other moving markets from a technical analysis perspective, explain technical analysis tools from a practical perspective and include guest commentary from a variety of roles across the financial markets.

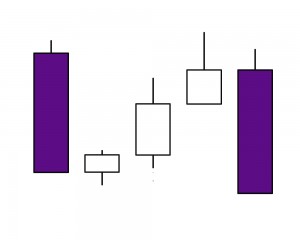
There aren’t many analysts out there that don’t now use candlestick charts as opposed to bar charts. The reason is quite obvious once you’ve seen a candle chart and it is that they offer everything a bar chart does but with the added value of graphically showing the key open and close. This immediately helps to... read more

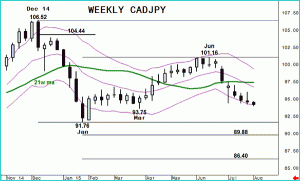
This year’s price action has been volatile but has also emphasised the importance of Fibonacci numbers in analysing from a technical perspective. The fall from last December’s peak reached almost 15 big figures before February began with a Bullish Engulfing pattern for CADJPY on weekly candle charts. That pattern often signals a complete change in sentiment direction... read more

After peaking at the top of the daily Keltner channel, at lower levels than January, three of the last four weeks have posted net losses in EURHUF. More importantly, after stalling at the 21 week moving average for 2 weeks, last week saw an acceleration of selling pressure. We look for the downside to develop in... read more

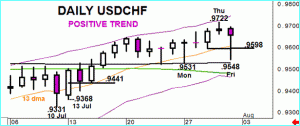
Last week saw USDCHF bought to higher levels for a 6th week in a row. Gains were not extensive and price action was distorted by volatility in the CHF as a whole. But Friday’s downside rejection maintained the market above the 13 day moving average (broadly unbroken throughout July) and the daily Keltner channel continues to... read more

I have written before on the USDTRY rise that has yielded more than 60-big figures since November’s base, and the influence that Marabuzo lines have had on trading during that time.These can be seen on the chart below marked in red.That situation continues with the weekly Marabuzo line created 9 weeks ago acting as a platform... read more


