
Posts tagged 'Candle'

A Bearish Head & Shoulders pattern was completed in February with CADJPY targeting 82.00. That target was exceeded by almost 1 1/2 big figures but that negative tone has clearly ended. CADJPY reached a 16 month low in March with, since that time, buying interest dominating the cross since. But until last week, a change to a... read more
A positive cross in AUDNZD RSI, through it's average rate, was seen at the end of January. This was confirmed by a 'golden' cross in the spot rate in early February. This confirmed a bullish bias on our Trend Table.Prices rose almost 3 1/2 big figures after that - taking AUDNZD to 11 month highs, to... read more
CRUDE OIL Update – Daily Shooting Star at 2nd test of neckline.In August our longer-term signals turned bullish in Oil when prices were trading just above $40. The initial target was at $51.34 and a potential target from a reverse Head & Shoulders formation is at $75.00. While this did raise some eyebrows our 1st target... read more
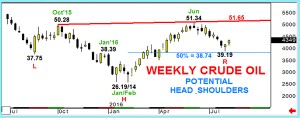
Update 20th OctoberCRUDE OIL - testing key necklineOn the 12th August our long-term analysis to buy Oil (43.49) was partly based on a similar pattern in FTSE. The market is now testing the key neckline and while we expect bullish sentiment in Oil to continue, there could be a pullback. For this reason we would take... read more
....The background to medium term analysis to CABLE has to be the bullish inverse Head & Shoulders pattern that the chart below shows.This year's trading has been dominated by downside attempts in January, March and April that formed the three bases that create the Head & Shoulders formation. This pattern very often confirms a strong change... read more
...A bearish Shooting Star pattern dominates EURUSDTuesday saw the gains from last week's low extend aggressively and prices reached the most positive levels for 9 months.But these extremes, and overbought extremes, were sharply rejected despite the prior hugging of the top of the Keltner channel.That upside rejection created a Bearish Shooting Star pattern on daily EURUSD... read more
EURUSD - Bullish Rising Three dominatesThis week's report on EURUSD is a bullish one. This is due, in part, to;3 Up weeks in succession5 Week HighsTracking the upper band of a positive Keltner channelSupport of the 13 day moving average.But the other key feature to note is the Bullish Rising Three pattern that was completed by... read more
... In T-Notes and T.Bond futures this year began with a renewal of demand. Demand that we expect to lead significantly higher.The move higher last week, almost 2 points in T-Notes and 3 1/2 points in Bonds, ended a sequence of 3 down weeks. Soem allowance has to be made to the fact that those weeks... read more
Longer-term signals for GOLD on our trend table had been bearish for some time, but a small monthly Doji candle in December at 6 year lows has also come from close to 1087.5, a key 50% pullback to the entire 2001-2011 bull market, switching signals going into January to neutral. However, this month’s strong open has... read more
The Shooting Star created at the beginning of May 2016 has been proved although the scope of the downside remains, at the time of writing, modest. see EURUSD - Shooting Star dominatesBut are Shooting Stars a good indication of a change in formation? Well, the bad news is that they are a rare pattern on FX charts.... read more