Is FTSE telling us that Oil has bottomed? – Update
20th October 2016
Update 20th October
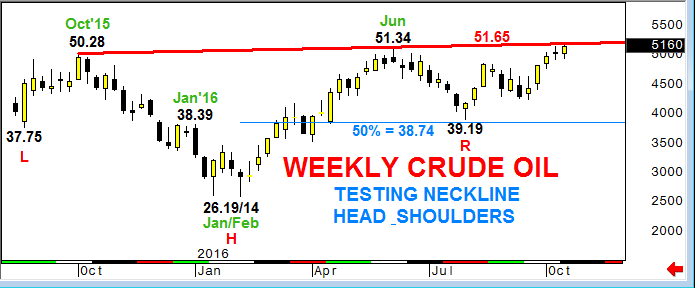
CRUDE OIL – testing key neckline
On the 12th August our long-term analysis to buy Oil (43.49) was partly based on a similar pattern in FTSE. The market is now testing the key neckline and while we expect bullish sentiment in Oil to continue, there could be a pullback. For this reason we would take some profit and raise the stop to the entry point
12th August 2016
FTSE has confirmed a bullish Head & Shoulders reversal, breaking the neckline in June and targeting 7400.0.
 Crude Oil is in the process of forming a similar pattern. The right shoulder is being formed, as the sell-off since June’s 51.34 top has stalled and reversed from close to 38.74, a 50% correction to the entire 2016 rally (26.14-51.34). A long trend of lower weekly highs has been ended this week, the first sign that sentiment may be switching to bullish.
 Longer-tern oil charts are yet to confirm this switch, but signals are improving.
 The end to a sequence of lower quarterly highs has switched our 3 month call on the trend table to bullish, but ideally the market needs to recover above the broken long-term quarterly bull trend to give confidence to bulls.
 However, in line with the trend table, signals are pointing to the probability that a long-term low is being put in place. The stop on this view is at 35.35, April’s base and targets are to 51.34, June’s high and 62.58, the 2015 top.
If the Head & Shoulders pattern is confirmed then Oil has a target near $ 75.00.


