DMI Difference – Useful for traders?
14th April 2016
I was recently questioned on a short-term chart that I drew that showed bearish triggers being given by moving average crossovers on the spot price, RSI, Momentum and DMI Diff.
The client had seen and used RSI and Momentum (nearly everyone has tried those indictors at some point) but wasn’t aware of the usefulness of DMI Diff movement.
Before I explain what the Diff indicator is in relation to DMI itself, and how I employ that as one of my intraday tools, we need to examine DMI first.
DMI Characteristics
There are two lines marked on the chart. The first (+DMI) measures on a percentage basis a moving average of the amount of higher highs recorded in the time period. The 2nd line is the opposite i.e. percentage of lower lows (-DMI). Placed on the same chart a higher +DMI signifies a bullish trend and a higher –DMI shows a negative bias. That is the simplest way of looking at it and certainty gives a great indicator of the underlying nature of the market.
However, a more dynamic use of the tool is the crossover – this occurs when the lower DMI moves up through the previously higher DMI on top. +DMI crossing up through –DMI is a bullish trigger and vice versa.
It has to be noted that this indicator can be a ‘lagger’ and so we generally regard it as a confirmation of signals already provided rather than the lead as you can see from the above where the sell signals lag more than the buy signals.
Lets take a look at an example;
You can quite clearly see in this intraday chart that the DMI sets the background trend nicely –setting a context that other studies can be used against.
However, the crossovers that are successful lag and there are a number that give false, temporary, signals that are counterproductive.
Given the drawbacks to this tool can we see more use in the DMI Diff tool? And here I should explain that this tool basically takes the Difference between the +vale and the -value and plots it as a simple line rather than a ‘Cloud’ between the 2 values. The advantage to that is that there are other ways to use the movement of the indicator to help determine bullish/bearish sentiment.
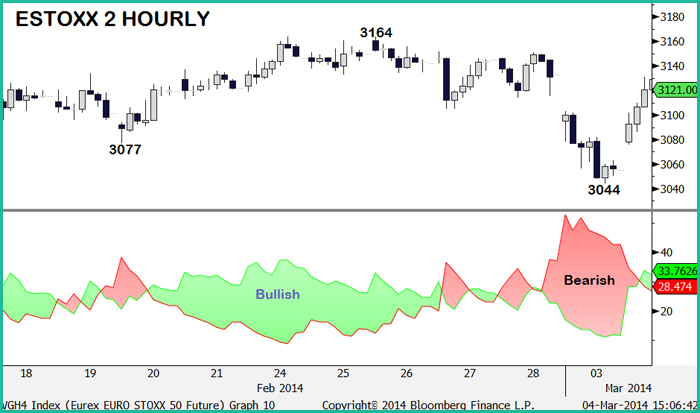
The chart below is a EURUSD 2 hourly chart with the DMI Difference marked below the spot price and a moving average added.
 Here you can see 2 triggers, bullish and bearish. Between them is an unconfirmed bearish move – by unconfirmed I mean that the spot price does not make a lower low after the DMI Diff trigger is given.
On the two examples highlighted confirmation did occur.In the fist instance subsequent upside was extremely limited but the second point provides a short position that could have yielded significant results.
For one more example we’ll move on to EURJPY on a daily basis.
Once again there are 2 signals provided over a month’s trading. Confirmation for the bullish trigger in DMI Diff was a move above 125.62. 260-pips was the subsequent upside potential. While the break below 124.86 confirmed a negative crossover and that, at the time of writing still has potential.
It must be emphasised that this indicator is not a stand alone buy/sell signal provider but can be a vital tool which taken along with other trusted indicators can help with trading decisions.
