Gilts – Trading with Stochastics
22nd July 2016
Everyone who watches a chart will have their own definition of overbought/oversold. There’s nothing wrong with that as long as consistency and a certain amount of pragmatism is used when applying.
I’ve lost track of the times I’ve been asked, as prices plunge, when is the time to buy – and vice versa. My answer is always the same ‘when the market tells you’.
It’s obvious that, broadly speaking, when something is overbought there will come a time when a reaction will occur. But that doesn’t happen always. Sometimes there is a sea-change in the markets understanding of the value of an asset, sometimes the situation corrects with time rather than price and at other times certain instruments are almost immune to normal overbought/oversold signals (i.e. JPY).
So, is it possible to trade such readings? The answer is yes of course if you let the market determine when. To illustrate this I’m going to use Sep Gilt futures (although the concept is valid across the asset classes) on an hourly basis and am using Stochastics as the reading of the over-stretched nature of the market (the inputs of this indicator are set out at the end of this article).
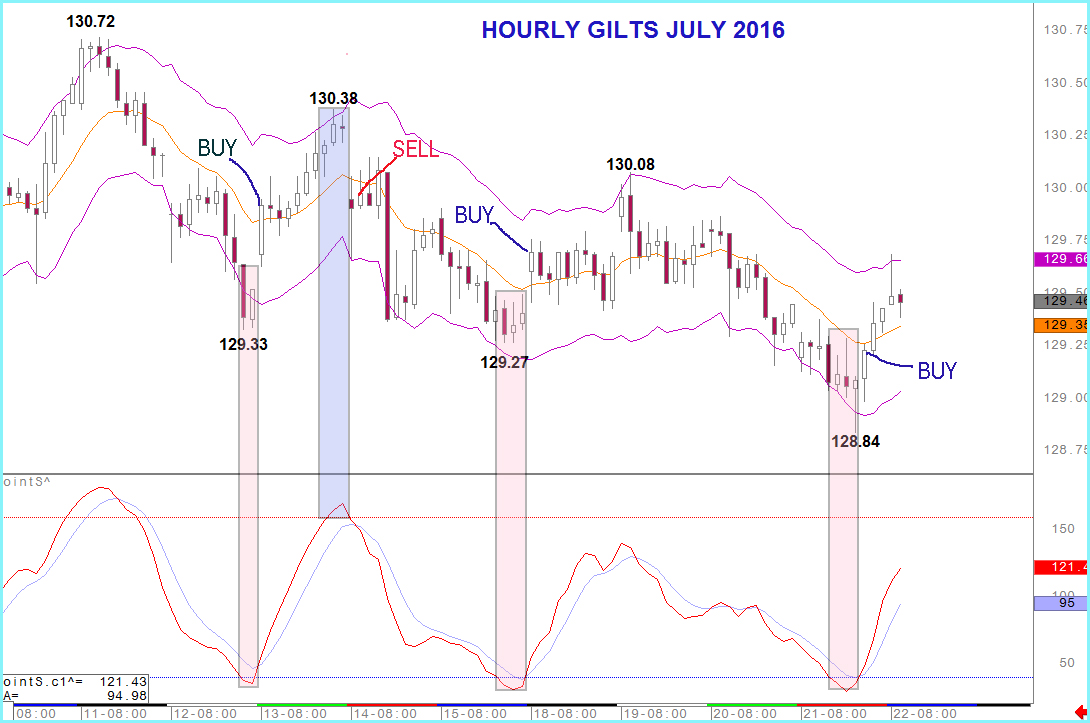
In the chart below, showing Gilts gradually drifting lower, there are 4 opportunities to trade. 3 of them counter trend.
The temptation is to start to accumulate longs as soon as the Stochastic reading is oversold and shorts when the indicator is overbought. In this particular example this method would have been successful. But as mentioned above such positions can get painful if a complete change in the market is happening.
So I suggest looking for confirmation before taking positions and while some will use a higher high, from oversold for example, as confirmation I watch the Stochastic indicator and it’s behaviour against it’s moving average. This moving average has a short term setting to try to trigger a signal as early as possible but long enough to try to avoid ‘noise’. (Settings below).
In the first instance Gilts have posted a low of 129.33 and reached oversold extremes. Confirmation is looked for by Stochastics trading above it’s moving average and that is provided in the first hour of the next day. Prices then rise throughout that day.
In fact that move leads to overbought Gilts and again it is early the next day that Stochastics trade below their moving average. While it is only the morning session that attracts sellers the decline is a sharp one.
Both the subsequent Buy signals in Gilts produced upside although the first led to a lower higher, in price and Stochastics that emphasised the underlying bearish trend for Gilts. The second example has had success but is still developing at the time of writing.
I hope this explanation will encourage you to take a look at this method of intraday trading yourself.
I should point out that the Stochastics indicator used in this article is personal adapted. The red line is an additional of the normal %K and %D lines using 13 hours as the basis. Therefore oversold readings are interpreted as anything below 40 and overbought as above 160. The moving average, the blue line, is a 5 hour exponential moving average of the combined Stochastics.
To assess our full analysis service for yourself free, please go to TRIAL
