Keltner Channels - Useful in Trending/Ranging markets
10th June 2015
Keltner channels were originally developed by Chester Keltner in his 1960 book ‘How to Make Money in Commodities’.
The basics have been amended since and the accepted default method is currently that the bands are based on the average true range (ATR) and calculated over 10 periods. This ATR value is then doubled and added to a 20 period exponential moving average for the upper (plus) band and subtracted from it for the lower (negative) band. This multiple of 2x is the default but there are many practitioners who use variations between 1.5 and 2.5.
Basically the smaller the multiple the more trading signals are provided. For an investor this is something to avoid so he would err towards the 2.5. For an intraday trader though more trading signals, as long as they’re filtered, is good.
Adapting the default Keltner channel
Once the Channel is drawn it can be used as a trading tool regardless of whether the market is trending or range bound. This, in itself, is unusual as most technical indicators provide signals in markets that have a defined direction and when the market is trendless their use is significantly diminished or can even be counter-productive. Before we look at both situations and the practical application of the Keltner channels, let me just point out the personal adjustments I make to the default inputs.
In Practice with personal adjustments.
Although the default uses exponential moving averages i have changed this back to a Simple Moving Average as I found this to produce more consistent results.
I have also altered the ATR moving average from 10 to 13. The reason here is that I am a firm believer in Fibonacci numbers and that gives an alternative in this situation of 8 or 13. Back testing has indicated that a consistent use of 13 provides the best results. Nonetheless, this is something that everyone should experiment with.
The first example we will look at is a Daily GBPUSD chart.
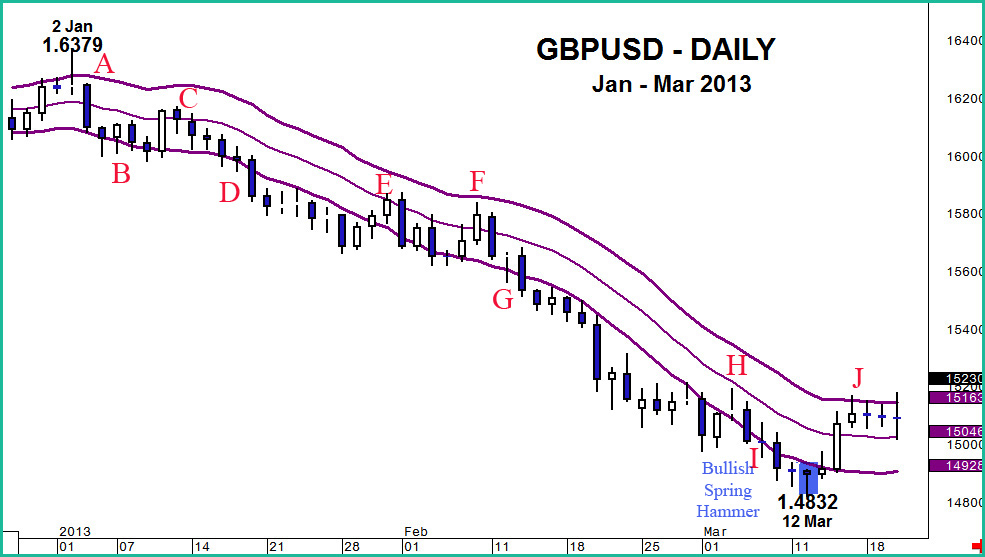
We can see quite clearly on this chart a steady decline from January’s high of more than 13 big figures and for the most part the ‘hugging’ of the lower end of the channel signalled the strength of the negative trend. Rallies were limited and it is only when prices maintain themselves near the top of the bands that an end to the bearish move is confirmed.
The rejection of levels outside the top of a flat Keltner channel on the first trading day of the year is the first indicator that more significant selling pressure may develop (A). This was confirmed by the following day’s strong decline to the lower end of the channel – a channel which then begins to slope downward and 4 days of prices embracing the lower end (B).
The bearishness of the new trend is then indicated by the limited extent of a rally. The market traded through the middle line of the Keltner but was unable to move to test the upper parameter and sellers soon returned to GBPUSD (C)
This fresh downward moved took GBPUSD clearly below the lower end of the range (D). Once the level has been exceeded by this sort of amount, especially when the channel is angled lower, the trend’s commitment is emphasised. This leads to a 6-7 day deterioration that keeps prices outside the parameters.
The next 2 rallies are a little more aggressive but although the second one does exceed the middle line. Neither move (E & F) touches the top and so the underlying trend lower is unthreatened.
The focus again returns to the downside and the lower end of the channel is once more sizeably exceeded (G) – reinforcing the negative tone and prices remain almost entirely outside the parameters for 13 trading days.
Another rally but without the strength to test even the middle line this time (H) and once more the trend remains intact.
Again GBPUSD moves outside the Keltner channel in what proves to be the last leg lower. (I)
In fact the low is marked by a Bullish Spring Hammer – which in itself would have given an early warning that the trend was under threat. Nonetheless confirmation would be needed and this was provided by a move back inside the bands.
and a move through the mid-point to the upper channel and consolidation there – an end to the bearish trend had been confirmed. (J)
Selecting Input
While the example above, and the ones following, show the formulas used in Keltner channels based on a closing basis. It is possible to draw the channel using the period Open, Low, Close or High.
These slides show the
Close – The default
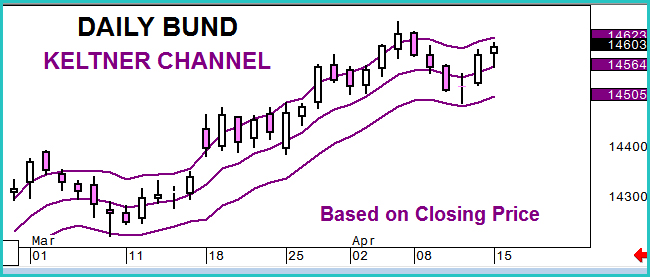
Open – showing little net difference
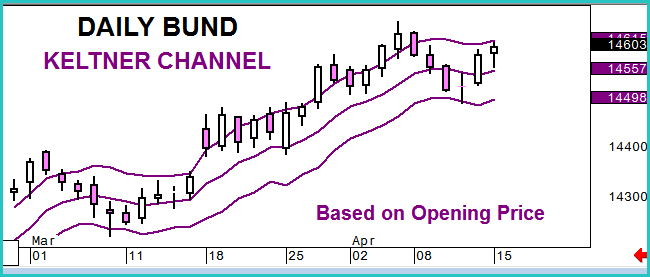
High – This will show extremes. Too conservative in an uptrend and aggressive on a downtrend.
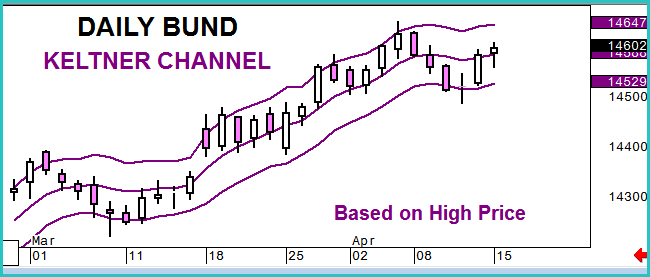
Low – The opposite to the High – aggressive in an uptrend and conservative in a down move.
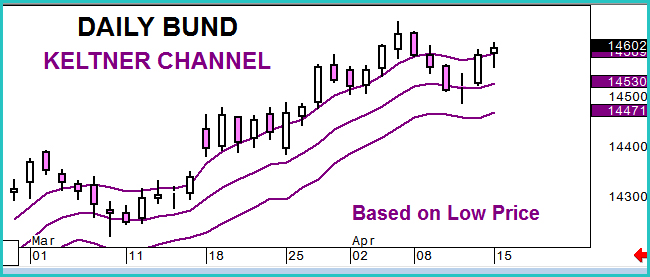
Overall these different formula can be played with and perhaps use different ones for an uptrend and for a downtrend. However for consistency I prefer to use the Close regardless of the situation.
Lets look at a 2nd example of a trending market.
This is for the DAX future and on an hourly basis. Here the Keltner channel confirms a strong period of investor buying that saw the market improve by more than 350-points.
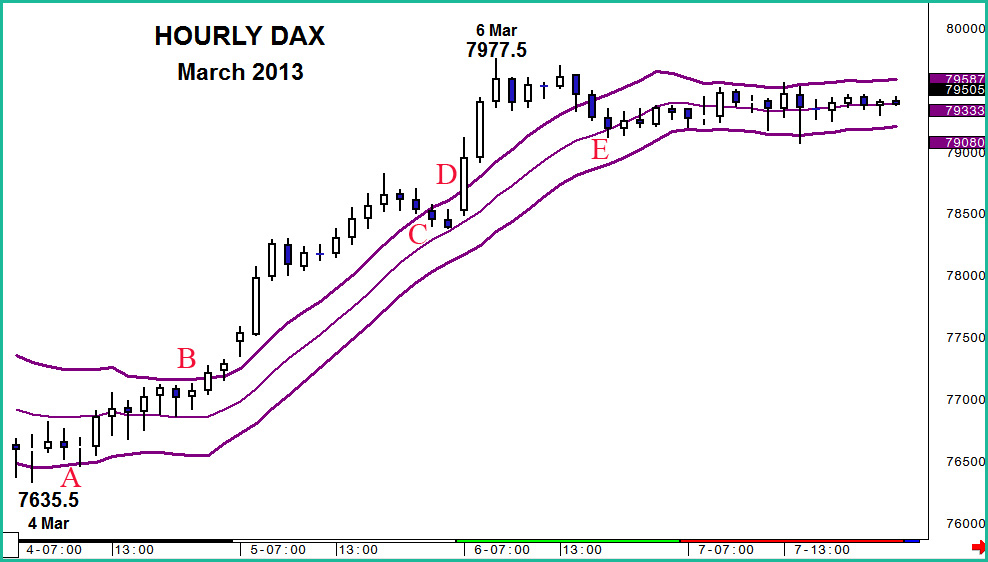
The move back inside the Keltner channel indicates potential for the trend to change from what was bearish or sideways. It is likely that other technical studies would be supporting that view. (A)
But a new bullish trend needed the confirmation of a move beyond the upper end of the parameters and this is provided by the move shown by (B).
In fact the gains accelerated above the channel and stayed outside for 13 hours – emphasising during that time the strength of investor demand.
Some profit taking developed (its likely that overbought Stochastics would have aided the warning of this setback) but the downside was restricted to the mid-point of the Keltner bands. (C)
The renewed upside was a sharp move that left the lines behind and was a clear sign that gains would extend quickly. This proved correct as Dax made its last upward leg.
The end to this positive trend was indicated when prices traded back to the middle line of the channel but did not lead to fresh buying interest (E). Instead the market began a period of consolidation and we shall next look at how Keltner bands can help trade a sideways market.
Our final example of using Keltner channels shows a broad trading range situation in weekly Bund futures despite the fact that the channel is actually rising very gradually.
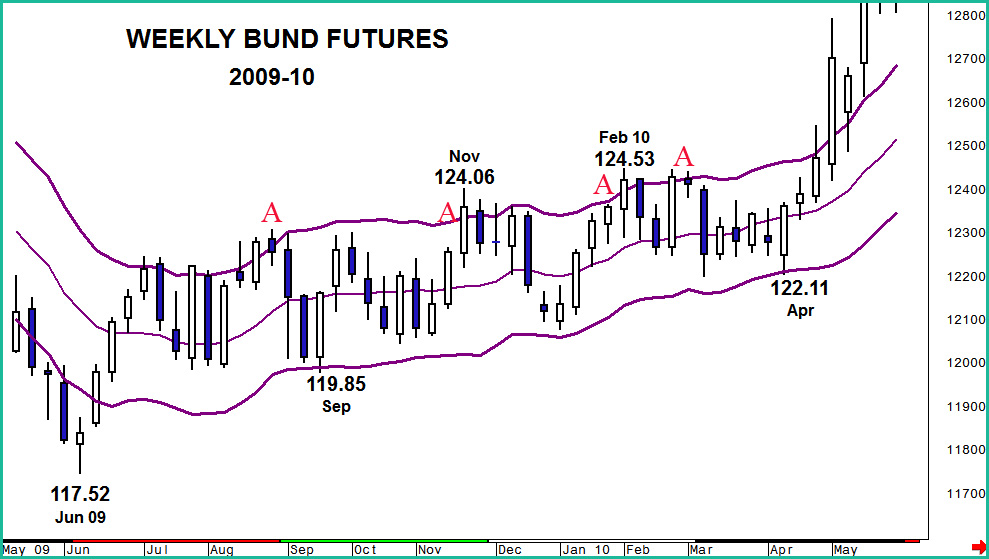
Here the topside of the band is tested on a number of occasions (A) but these tested are weak and have no follow through. While this might not be obvious the 1st time, subsequently it would be wise to await either a powerful break or confirmation provided by a 2nd consecutive close through the band.
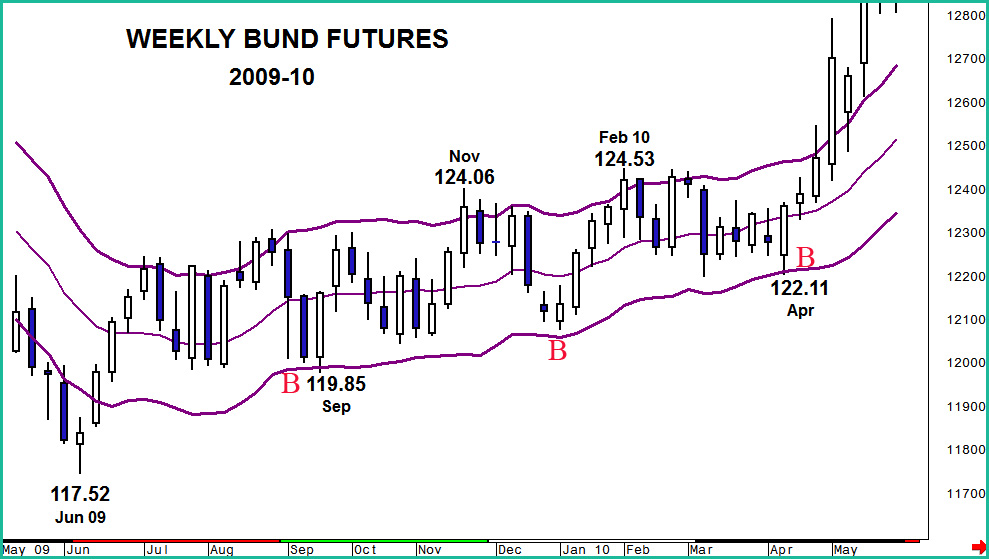
The same situation develops at the base of the parameters (B) and this mirror image of what is happening at the top of the channel reinforces the background of a lack of strong direction and the opportunity to trade the bands by Buying the lows and selling the Highs.
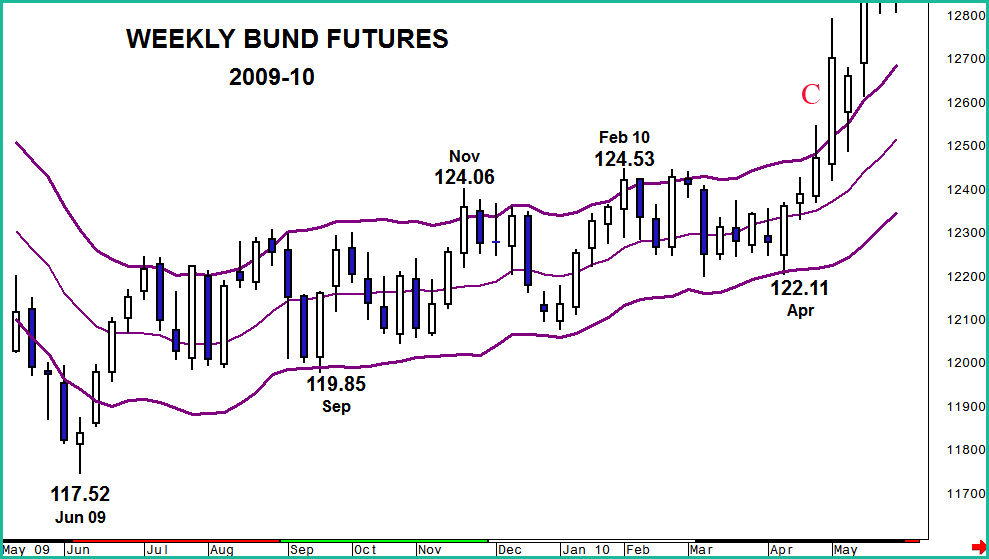
We mentioned earlier that it need a clear break of either extreme to end this range trading and this is what eventually developed (C). A strong move higher and then confirmation the next week indicates that demand is accelerating and this proves correct.
So we can see that Keltner channels are probably at their best when used in a trend following situation, like most other technical tools, when the breaking of the outer parameters gives confirmation that significant acceleration in direction is taking place. However, the ability of the bands to show potential buy/sell points when the market is in consolidation phase marks it out as one of the better technical indicators available.
It must be stressed though that Keltner channel signals for trading purposes be used in conjunction with other tool such as Candle patterns or Stochastics rather than viewed as ‘stand-alone’.
