Bullish Candle Signals
5th July 2015
There aren’t many analysts out there that don’t now use candlestick charts as opposed to bar charts. The reason is quite obvious once you’ve seen a candle chart and it is that they offer everything a bar chart does but with the added value of graphically showing the key open and close. This immediately helps to understand the underlying tone of the market and also, by means of the formations we will cover, gives clues as to the market’s direction.
Bullish Patterns
Bullish Morning Star
This pattern is not a common one but probably the most dynamic. This is due to the fact that it is made up of 3 candles which shows, naturally, longer and clearly market sentiment. As you can see from the image shown, the classic setup for a Bullish Morning Star is, for the first candle, a strong move lower that maintains the underlying negative tone of the market.
Prices then consolidate and the resulting candle shows little net movement – this can be minor gains, losses or, preferably, virtually no net movement.
Often this hesitation is followed by a renewal of selling pressure and the overall tone of the market is intact, but when the 3rd candle shows powerful buying interest –and gains must reverse more than half of the net losses – then the Morning Star pattern is confirmed. This is likely, when taken in context, to prove the catalyst for a complete change in the market’s attitude to value.
Trial our full Analysis service
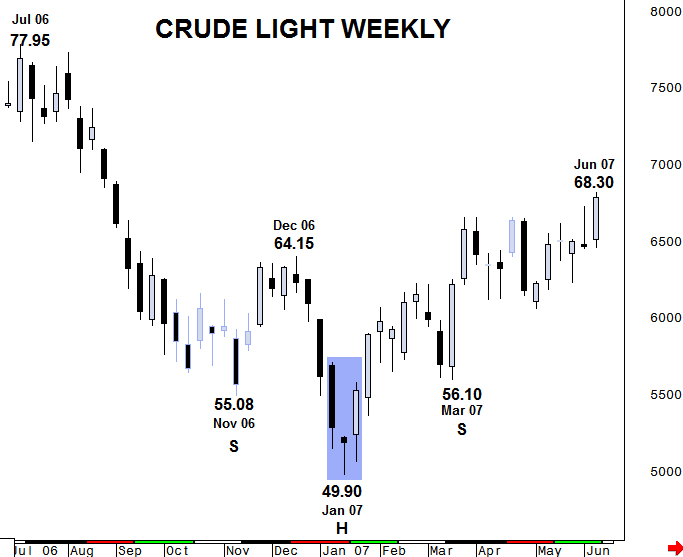
Above is a chart of Weekly Crude Light Oil from 2006-07 showing a Bullish Morning Star.
This is the opposite formation to the GBPUSD shown above. This weekly chart shows Crude falling more than $28 from the July 2006 high with one small rally from Nov to Dec. The scope of the move meant that all technical indicators were oversold and ripe for a correction or change in sentiment.
After the December top the market produced 4 down weeks of increasing size, the last of which can subsequently be seen as the first candle in the Morning Star pattern. These were followed by further losses the following week to a new low beneath $50 but the lows were rejected with the net result of only a very marginal net decline.
Small candle bodies denote indecision, or in this case a stalling of selling pressure and the individual candle was also a Bullish Hammer. Enough evidence there to warn sellers.
The complete change in direction, and the Bullish Morning Star, was complete the following week’s strong improvement. Prices steadily rose from that point.
It is worth noting that the magnitude of this buy signal was increased markedly by a reverse Head & Shoulders pattern, the Head of which was the Morning Star. Although not shown on the image above these two buy signals resulted in a rise to 146.65 in June 2008, the all-time peak.
Bullish Engulfing Pattern
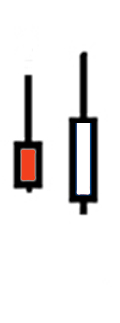
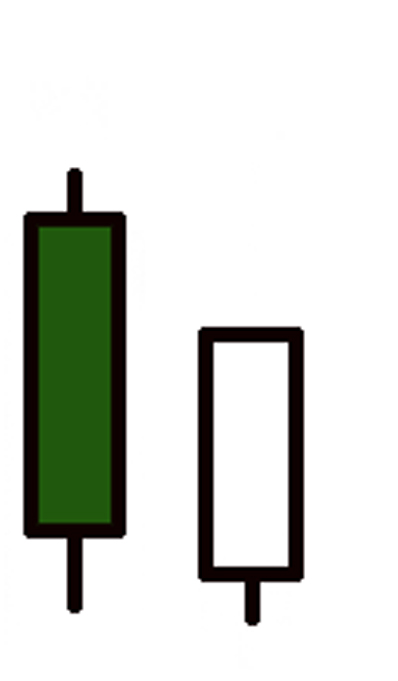
Engulfing patterns (Bullish & Bearish) consist of 2 candles and also signals a complete change of direction. Here you can see a Bullish Engulfing pattern with the 1st candle showing upside rejection and modest net losses but the 2nd candle shows a renewal of demand that, open to close, totally engulfs the previous period’s ‘real body’. Obviously the larger the price action shown by the first candle, the more significant the reversal can be – there should however be an awareness that exceptionally large candles, first and second, probably denotes a non-technical event and therefore some awareness of the context may be needed to assess the impact.
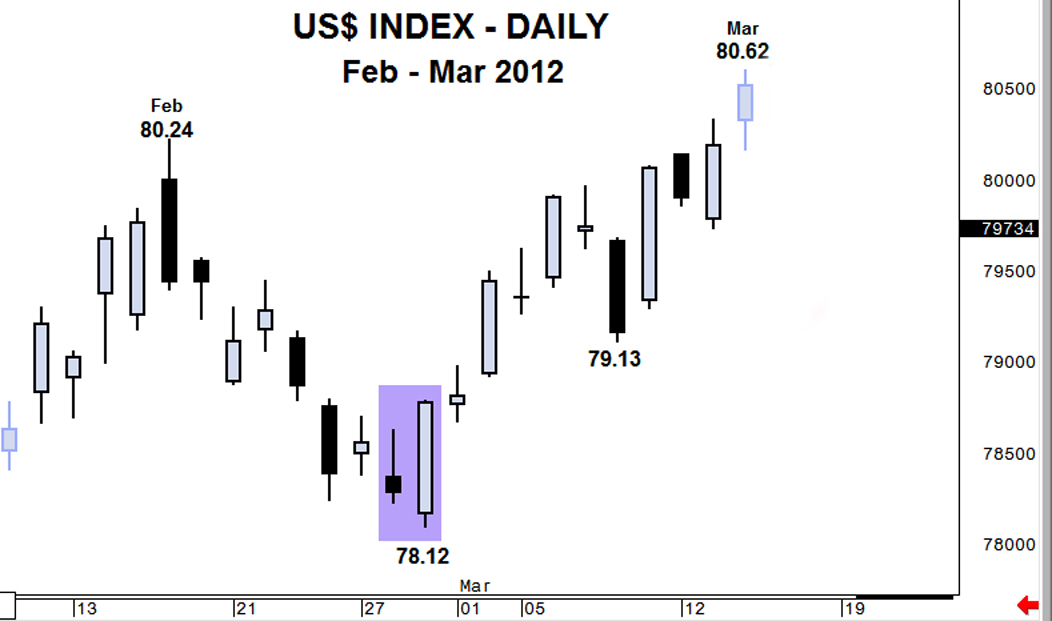
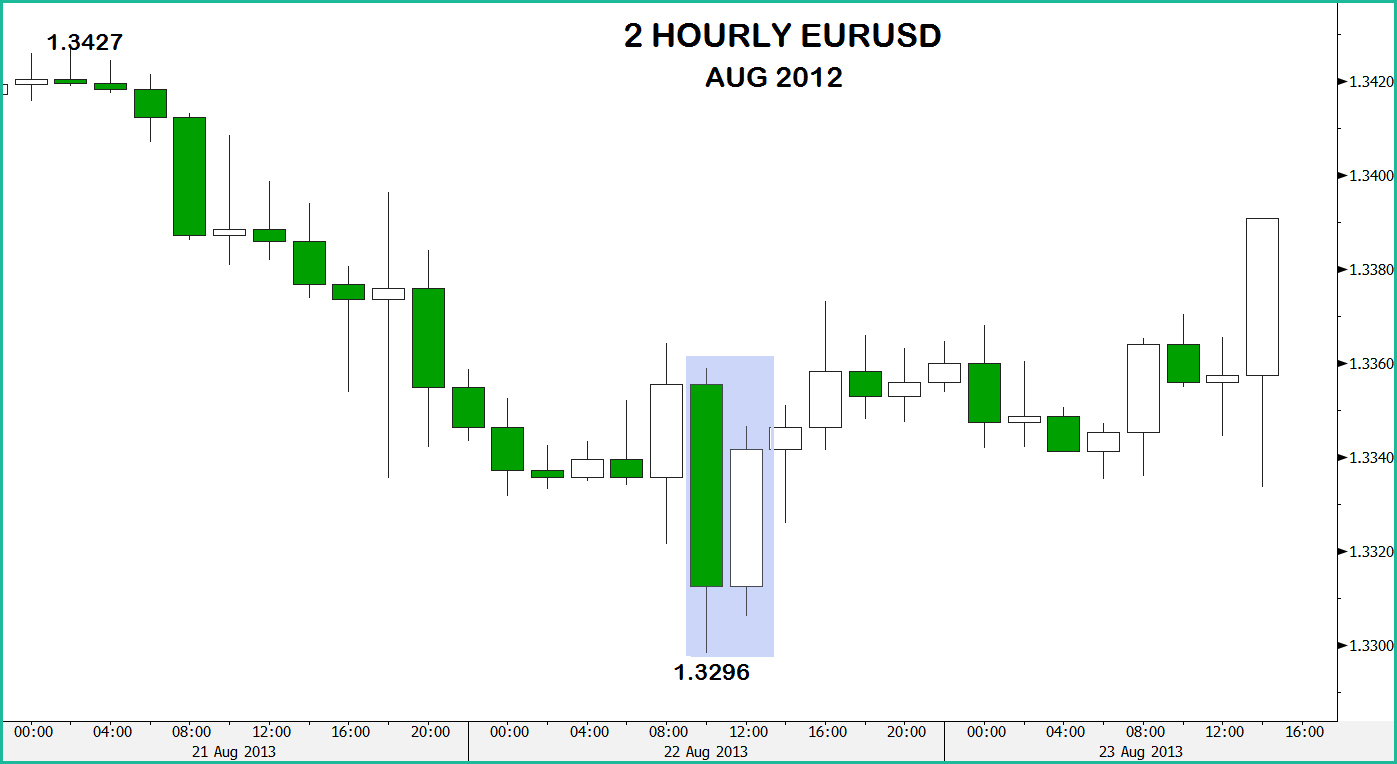
This is a perfect example of the Bullish Engulfing pattern and is also a prime illustration of the importance of context.
Trial our full Analysis service
Here the Index of the US% decline by more than 2-points over 9 days but this selling pressure was aggressively overturned with a powerful improvement that easily ‘engulfed’ the previous days decline and also closed at the highs.
This positive signal was confirmed as the Index rose by 2.5-points in the subsequent 10 trading sessions.
Bullish Piercing Pattern
This is another 2 candle pattern with a sizeable decline (dark candle) followed by an aggressive turn in sentiment. This renewed buying is not strong enough to recover the preceding period’s entire net fall (real body) but to qualify as a Piercing pattern, it must regain more than half of the net losses.
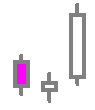
Bullish Spring Hammer
This is one of my favourite patterns and although it is only a one candle formation I find that if used with Stochastics oversold, or prices basing near a trend or Fibonacci level, then it can be a great indicator of demand. The key element, see the image to the right, is the rejection of lower levels and it often doesn’t matter if the net result is a minor decline or improvement. From the textbook the ‘tail’, difference between the real body and the low, should be at least twice that of the body (open-close) but in practice I like to see a tail longer than that.
Trial our full Analysis service
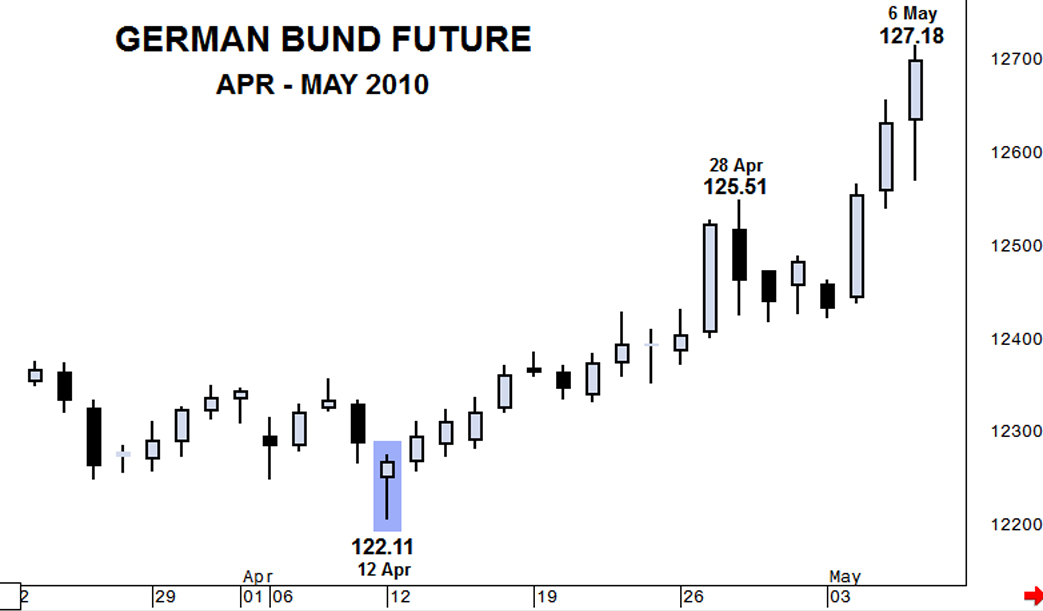
This time the bullish signal doesn’t come at the end of a downtrend but instead after a period of sideways range trading. Nonetheless the sharp rejection comes at a significant low of 122.11. The fact that there was a negative gap open from 11th April to 12th, then that day was followed by a bullish gap emphasises the turnaround in investor sentiment.
This bullish sign led to gains of over 7-points in the following 18-days.
Rising Three
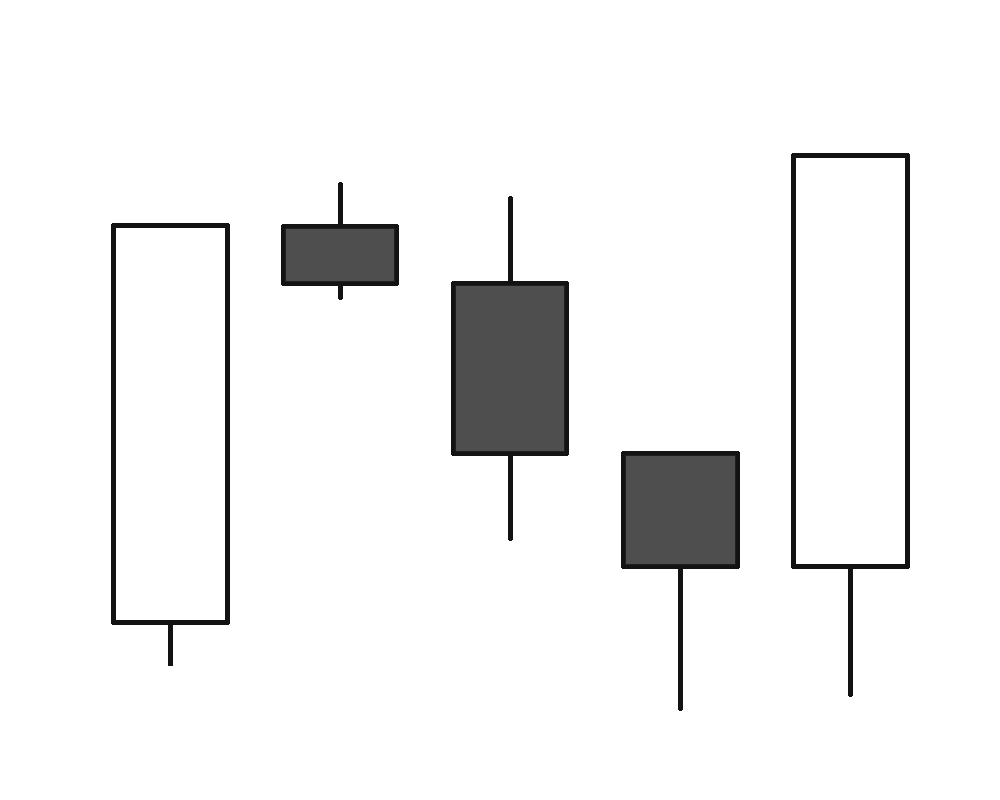
This pattern could also be regarded as continuation. The bullish trend is continuing with a strong rise for the 1st candle. This is followed by a profit taking setback that lasts between 2-3 periods but this countermove should ideally not break out of the real body parameters of the 1st candle.
The pattern, and a renewal of the underlying trend, is completed by a 5th candle that completely regains the preceding 3 periods of decline.
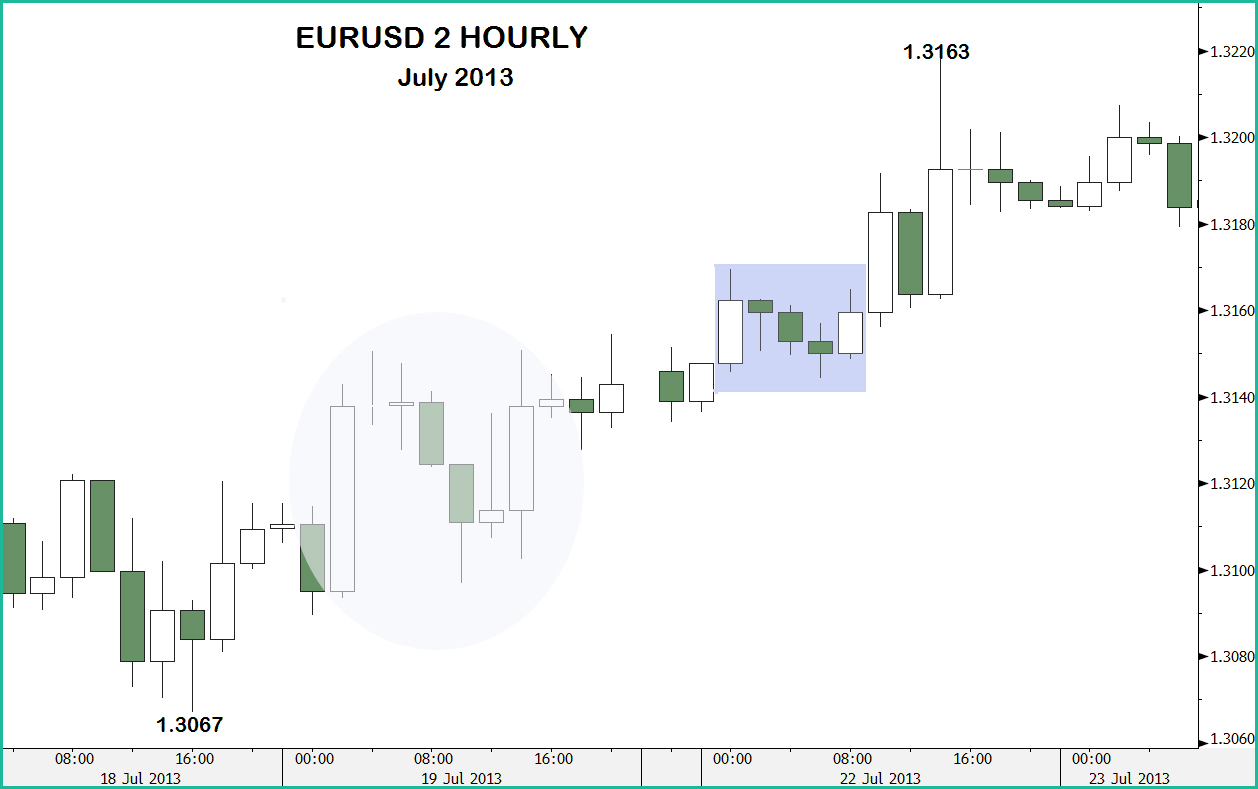
Here we have a good example and a less perfect example of a Rising Three method which is basically a 5 candle pattern (textbook) with the middle 3 candles moving, counter-trend, lower but with the 1st and 5th candle continuing the underlying trend.
